Modern Data Architecture: Graph Databases and Streaming Pipelines for Automotive Analytics
Why Traditional Databases Struggle with Modern Business Questions
Modern enterprises face two critical challenges that traditional relational databases weren’t designed to solve:
- Understanding complex relationships: “Which suppliers are affected if we recall this brake component?” requires understanding connections across parts, assemblies, vehicles, and supply chains
- Real-time business operations: “What’s happening right now?” requires instant synchronization across dozens of specialized systems (ERP, PLM, manufacturing, quality)
Since 2023, we’ve been helping automotive and industrial clients solve these challenges with two complementary technologies:
- Neo4j graph databases for relationship-centric analytics
- Apache Kafka for real-time data streaming
This article explains how we use these technologies, combining illustrative scenarios with actual project implementations, showing why they deliver business value that traditional approaches cannot.
Part 1: Graph Databases for Relationship Analytics
The Business Problem
A typical automotive OEM needs to answer questions like:
- “If we change this brake pad material, which vehicle models are affected?”
- “Which suppliers provide parts for our new electric vehicle platform?”
- “Can we trace quality defects back to specific component batches?”
- “What’s the blast radius if Supplier X has a production disruption?”
These are relationship questions—they require understanding how parts, assemblies, vehicles, suppliers, and quality data connect to each other.
Traditional approach: Database analysts spend hours (or days) writing complex SQL queries joining 6-10 tables with recursive logic. Queries are slow, brittle, and difficult to explain to business stakeholders.
How Graph Databases Change the Game
Graph databases store data as nodes (things) and relationships (connections between things), mirroring how we naturally think about business problems.
Graph database advantages:
- Natural modeling: Business relationships become explicit database relationships
- Fast relationship queries: Significantly faster than SQL for multi-level traversals
- Flexible schema: Easy to add new relationship types as business needs evolve
- Visual exploration: Business users can see and navigate the data graph
Illustrative Scenarios: Graph Database Applications
The following scenarios demonstrate typical use cases for graph databases in automotive contexts.
Scenario 1: Automotive Supply Chain Risk Analysis
Client Challenge
Large automotive manufacturer needed to understand supply chain vulnerabilities across their global operations:
- Thousands of unique parts across multiple vehicle platforms
- Complex supplier tiering relationships
- Multiple manufacturing plants with different production schedules
- Question: “Where are our single points of failure?”
Traditional Database Limitations
Their existing relational database could answer specific questions (“Which parts does Supplier X provide?”) but struggled with:
- Multi-hop queries (“Which vehicles use parts from suppliers in Region Y?”)
- Impact analysis (“What stops if this supplier fails?”)
- Pattern detection (“Which supplier relationships create bottlenecks?”)
Query performance degraded exponentially with relationship depth.
Graph Database Solution
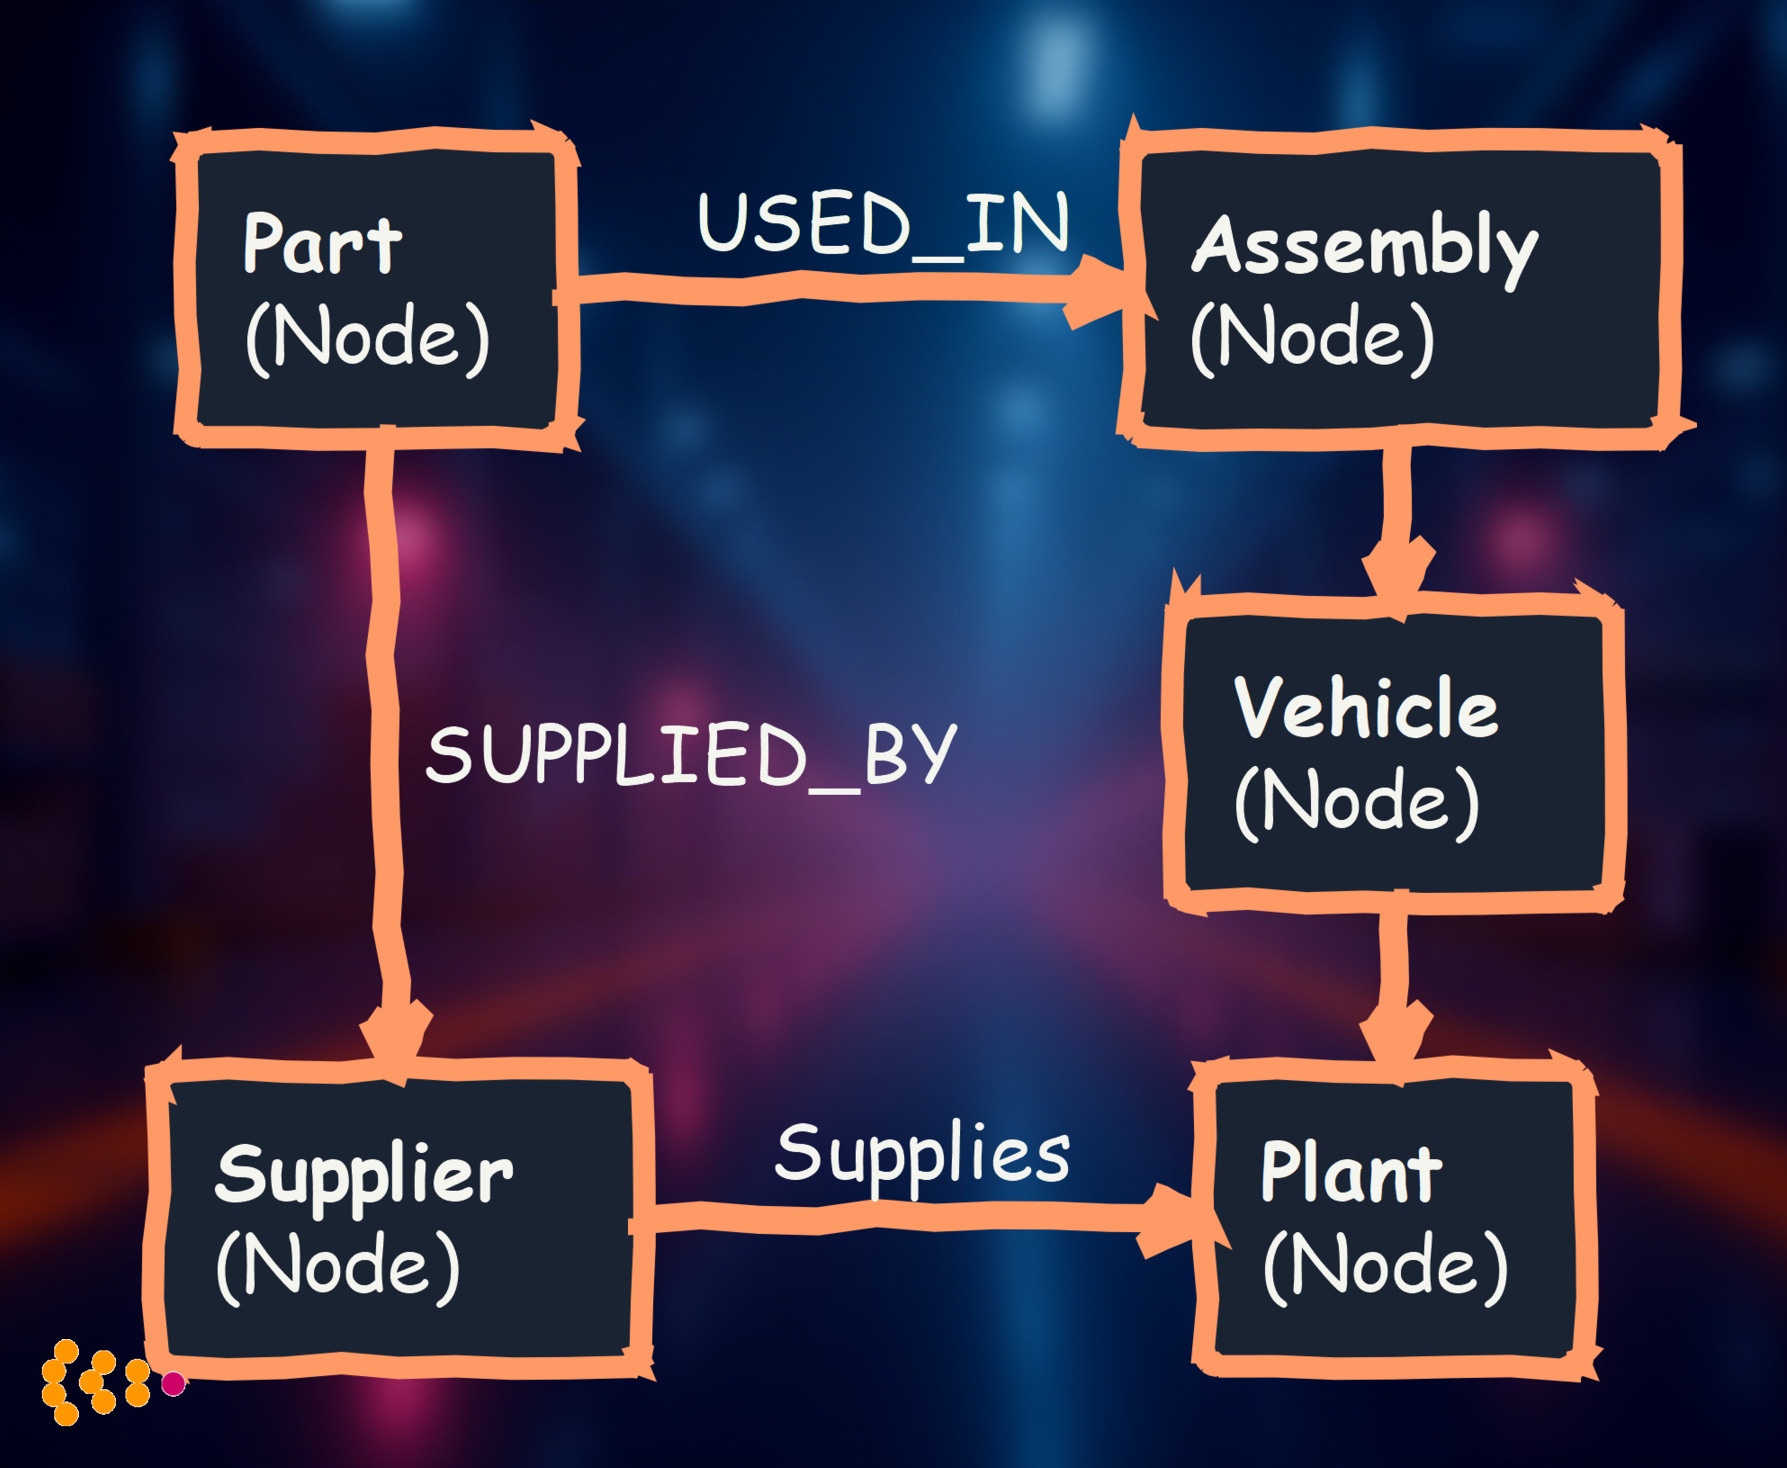
We built a supply chain knowledge graph in Neo4j connecting:
Data loaded:
- Bill of materials from PLM system
- Supplier master data from ERP
- Manufacturing location data
- Quality defect histories
Example Results
1. Instant Impact Analysis
Question: “If Supplier ABC stops delivering, which production lines are affected?”
- Traditional database: Slow query performance, complex SQL
- Graph database: Fast visual answer showing affected plants and vehicle counts
Result: Procurement team identified critical suppliers with no backup—initiated supplier diversification program.
2. Quality Root Cause Analysis
Discovery: Brake assembly defects correlated with specific component batches from a particular supplier
- Before: Required extensive manual analysis across multiple systems
- After: Graph pattern matching found the correlation quickly
- Impact: Enabled targeted recalls instead of broad market actions
3. Engineering Change Impact
Question: “If we upgrade to lightweight titanium brake rotors, what else changes?”
- Graph immediately showed all affected assemblies, vehicle models, and compatible parts
- Engineering team could assess full change scope before committing
- Result: Accurate project timeline and budget estimates from day one
Scenario 2: Vehicle Platform Modernization with Digital Twins
Client Challenge
Automotive manufacturer transitioning to electric vehicle platform needed:
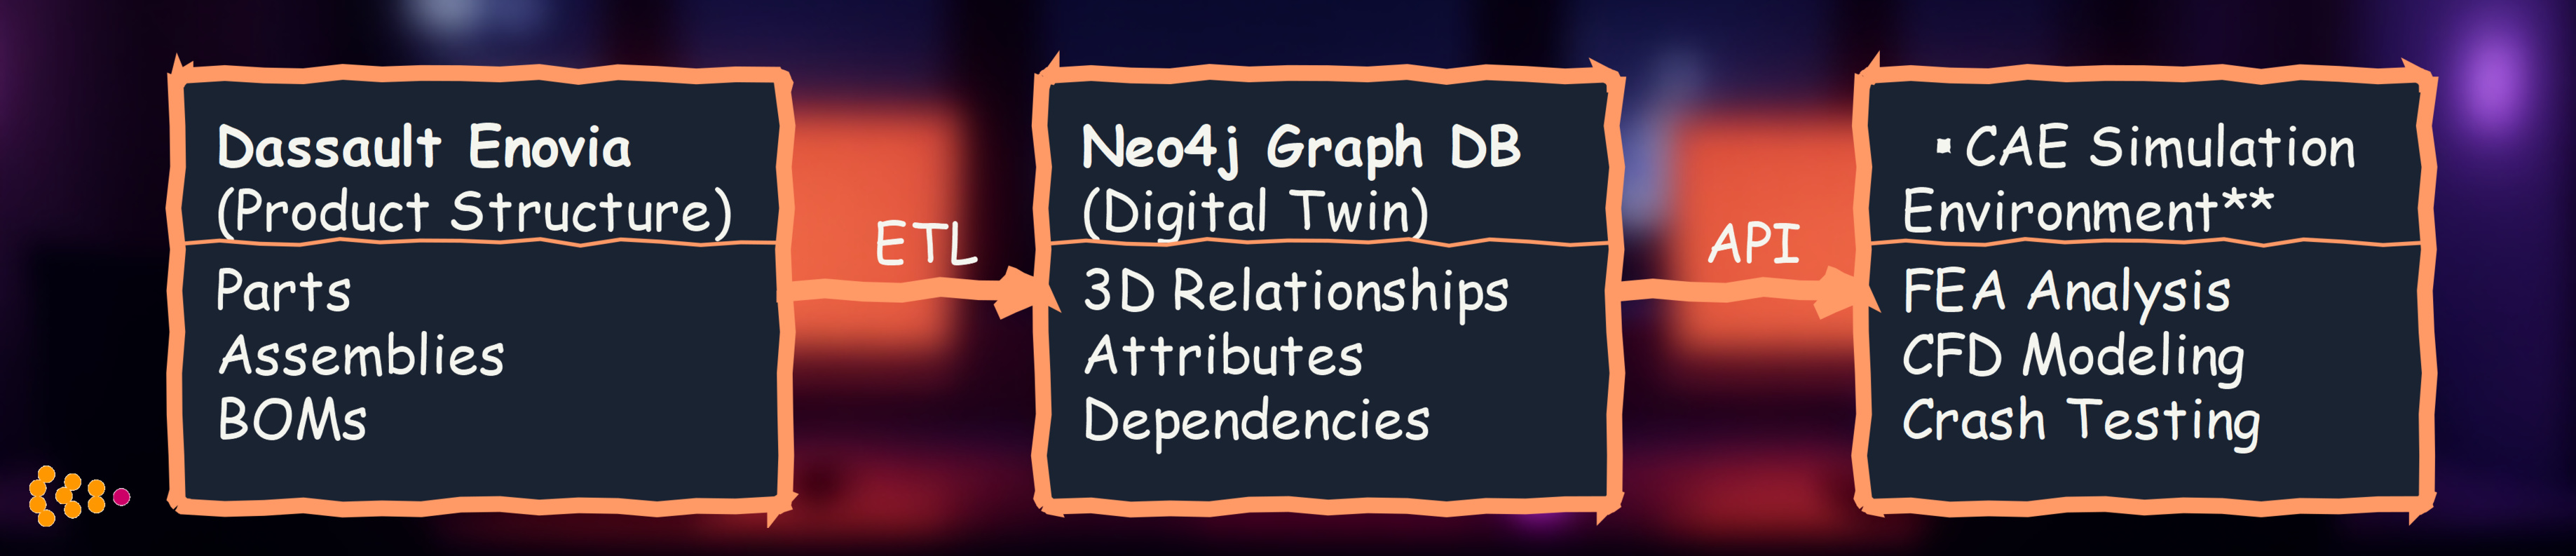
- Digital twin of complete vehicle for CAE simulation
- Integration of product structure data from Dassault 3D Experience / Enovia
- Real-time synchronization as engineering teams update designs
- Visualization of complex assemblies for non-engineers (executives, manufacturing planners)
Why Graph Database
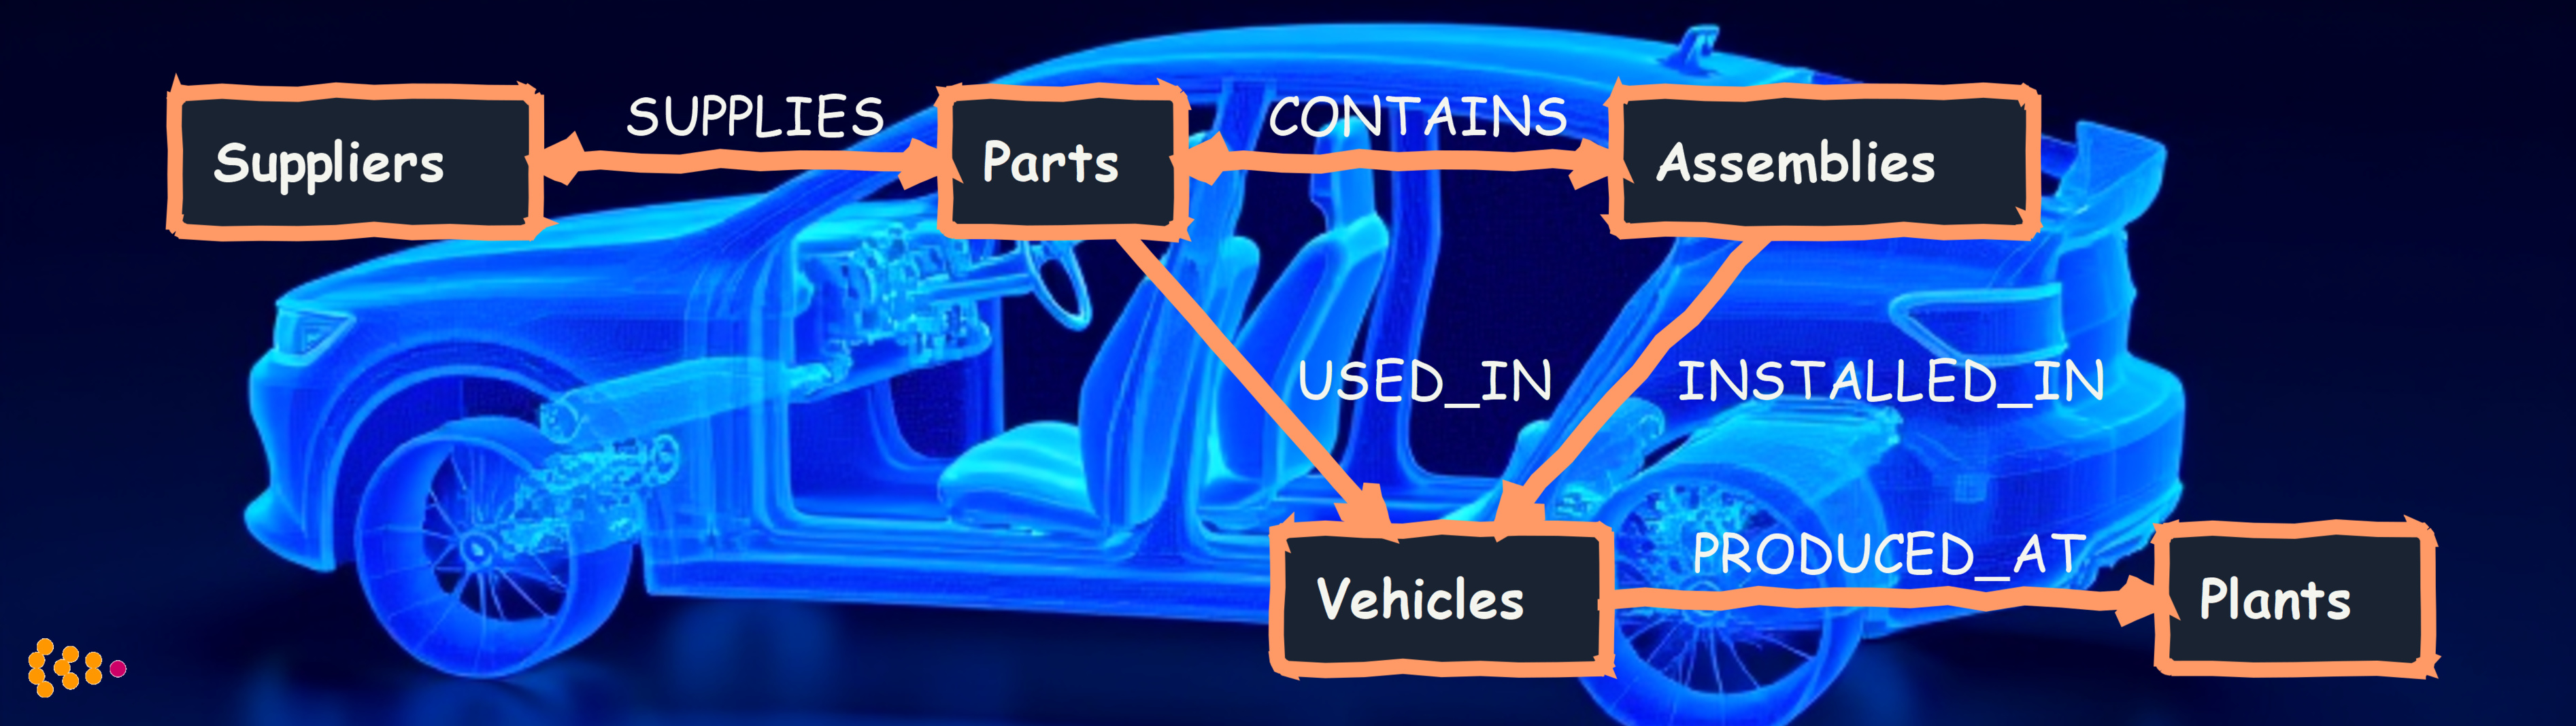
Electric vehicle has thousands of components with complex spatial, electrical, and thermal relationships:
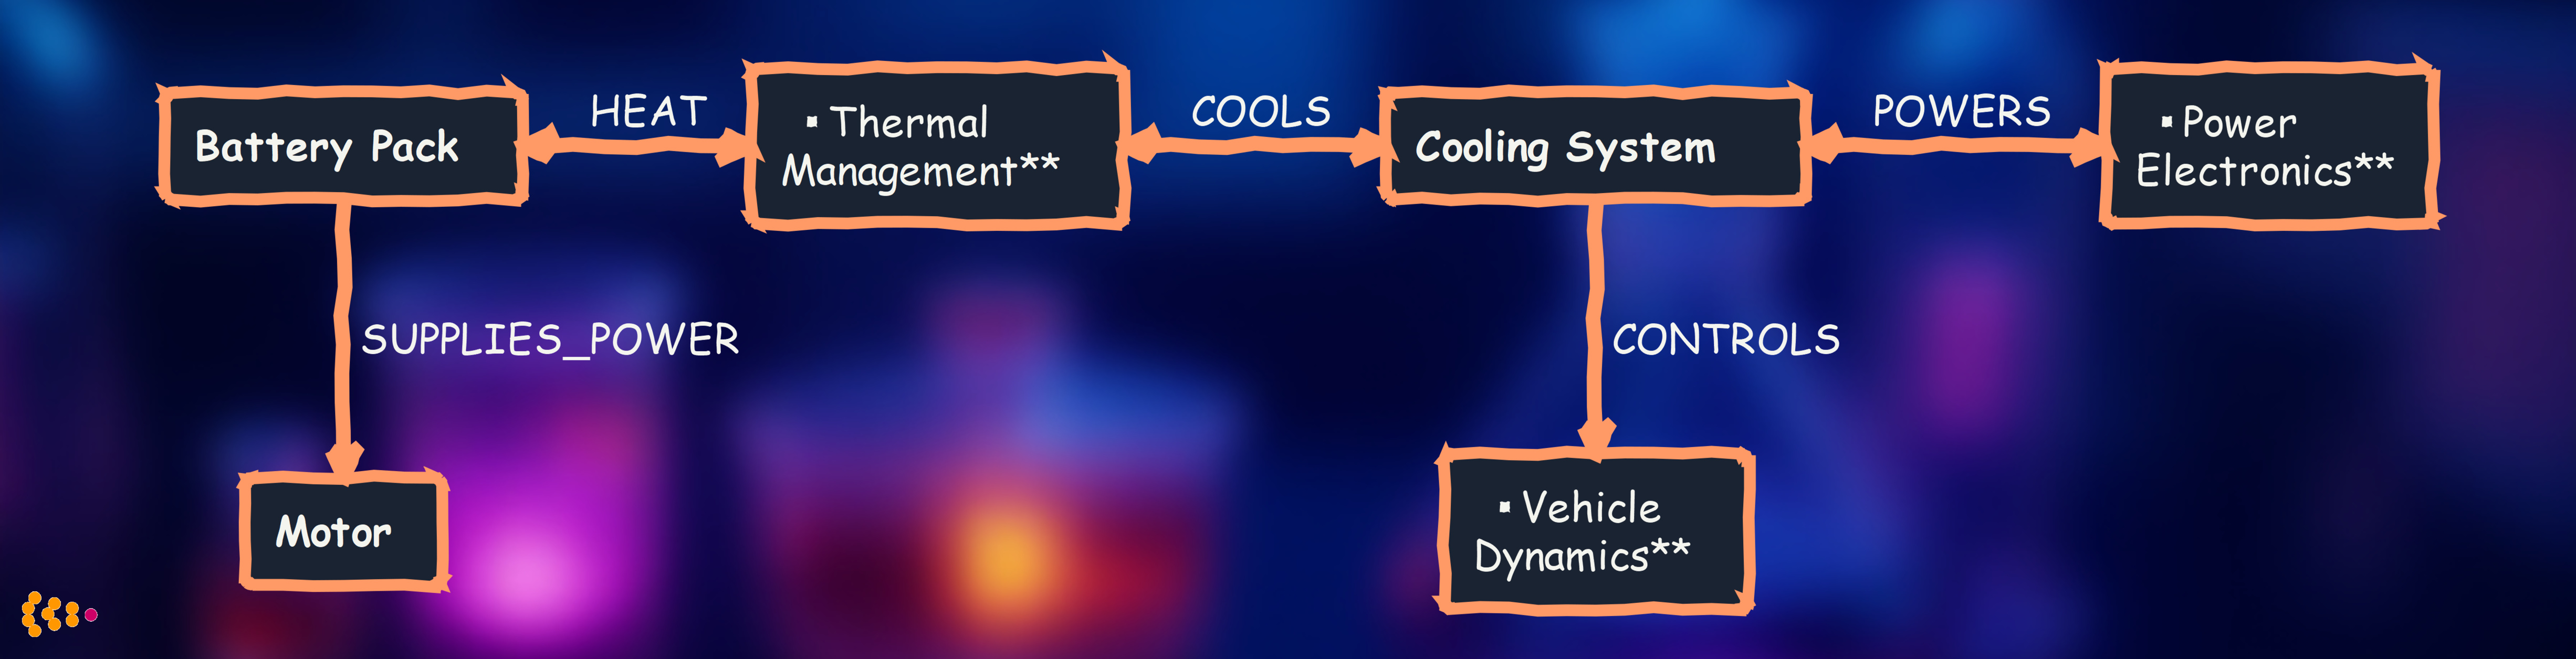
Graph database advantages:
- Model spatial relationships (what’s mounted where)
- Track data flow (which sensors feed which ECUs)
- Understand dependencies (changing battery affects thermal, cooling, power, motor)
- Visual exploration for cross-functional teams
Solution Architecture
Actual Project: Virtual Vehicle Comparison System
Project Context
Since 2023, we’ve been working with a Neo4j graph database containing virtual vehicle structures for automotive engineering analysis.
Graph Database Contents
Virtual Vehicle Structures:
- Positioning information: Spatial relationships between components
- Administrative structure: Module hierarchy, construction groups, production process groups
- Organizational data: Responsible business departments for each part
- Change history: Complete audit trail of modifications for each part in each structure/virtual vehicle
Business Application
We developed a dedicated application that leverages the graph database to:
- Compare similar virtual vehicles: Analyze different vehicle projects side-by-side
- Detect BoM inconsistencies: Identify discrepancies in Bills of Materials across vehicle variants
- Track organizational ownership: Understand which departments are responsible for specific components
- Analyze change patterns: Investigate how parts evolve across different vehicle projects
Value Delivered
- Consistency validation: Engineering teams can quickly identify where similar vehicles have different part configurations
- Quality assurance: Catch BoM errors before they impact production
- Cross-project learning: Understand best practices by comparing successful vehicle projects
- Organizational clarity: Clear visibility into departmental responsibilities for each component
Graph database architecture for virtual vehicle structures with comparison application
Actual Project: Geometry Data Streaming Architecture
Project Context
For the same automotive client with the Neo4j virtual vehicle database, we architected a Kafka-based streaming solution to distribute geometry data from a central Geometry Master Database.
Architecture Components
Primary Data Flow: Kafka topics stream real-time changes to multiple consumers:
- Structure updates: Changes to vehicle hierarchies and part relationships
- Position changes: Updates to spatial positioning data
- Administrative changes: Modifications to module assignments and construction groups
- Change history: Complete audit trail events
Consumer Systems:
- Neo4j graph database: Powers the virtual vehicle comparison application described above
- Generic analytics data hub: Maintains historical data and enables trend analysis
- Partner systems: Engineering tools, manufacturing systems, and quality management platforms
Bi-directional Synchronization
The architecture maintains data consistency through a sophisticated feedback loop:
- Partner systems publish their updates back through Kafka topics
- These updates flow to pool tables in the Geometry Master Database
- Ensures changes made in distributed engineering systems are reflected in the authoritative data source
- Maintains single source of truth while enabling distributed collaboration
Real-time event streaming architecture with bi-directional synchronization
Part 2: Real-Time Data Streaming with Apache Kafka
The Business Problem
Modern enterprises run specialized systems for different functions:
- ERP (SAP): Procurement, finance, master data
- PLM/PDM: Product design and engineering
- MES: Manufacturing execution
- Quality Management: Defect tracking, audits
- Data Warehouse: Analytics and reporting
The challenge: Keeping all these systems synchronized with current data.
Traditional approach: Nightly batch jobs extract data from source systems and load into targets.
Problems:
- Data lag: Business decisions made on outdated data
- Complex integration: N systems require N² point-to-point connections
- Brittle: Adding a new system requires modifying all existing integrations
- Inconsistency: Different systems have different “versions of truth”
How Kafka Solves This
Apache Kafka acts as a central event log that all systems can publish to and subscribe from.
Key concept: When anything changes in any system, it publishes an event to Kafka. All interested systems consume that event and update themselves.
Benefits:
- Decoupling: Systems don’t talk directly to each other—they talk through Kafka
- Real-time: Changes propagate in seconds, not hours
- Scalability: Adding a new system means connecting it to Kafka, not modifying existing integrations
- Resilience: Kafka stores events durably—if a consumer is down, it catches up when it restarts
Illustrative Scenario: Automotive Data Hub for Real-Time Operations
The following scenario demonstrates typical Kafka streaming architecture benefits.
Client Challenge
Global automotive manufacturer had:
- Multiple core systems with different data ownership
- Batch ETL running nightly—data significantly out of date
- Numerous point-to-point integrations (brittle, hard to maintain)
- Business question: “Why can’t we see current production status in real-time?”
Why This Matters
Use case 1: Supply Chain Disruption
- Supplier notifies of delivery delay
- Old system: Procurement enters it into ERP, nightly batch updates planning systems, manufacturing learns about it next day
- Impact: Significant delay, missed production targets, expedited shipping costs
Use case 2: Quality Issue
- Manufacturing detects defect pattern
- Old system: QA system updated, nightly batch to quality analytics, engineering gets report next day
- Impact: More defective parts produced before issue flagged
Kafka Streaming Solution
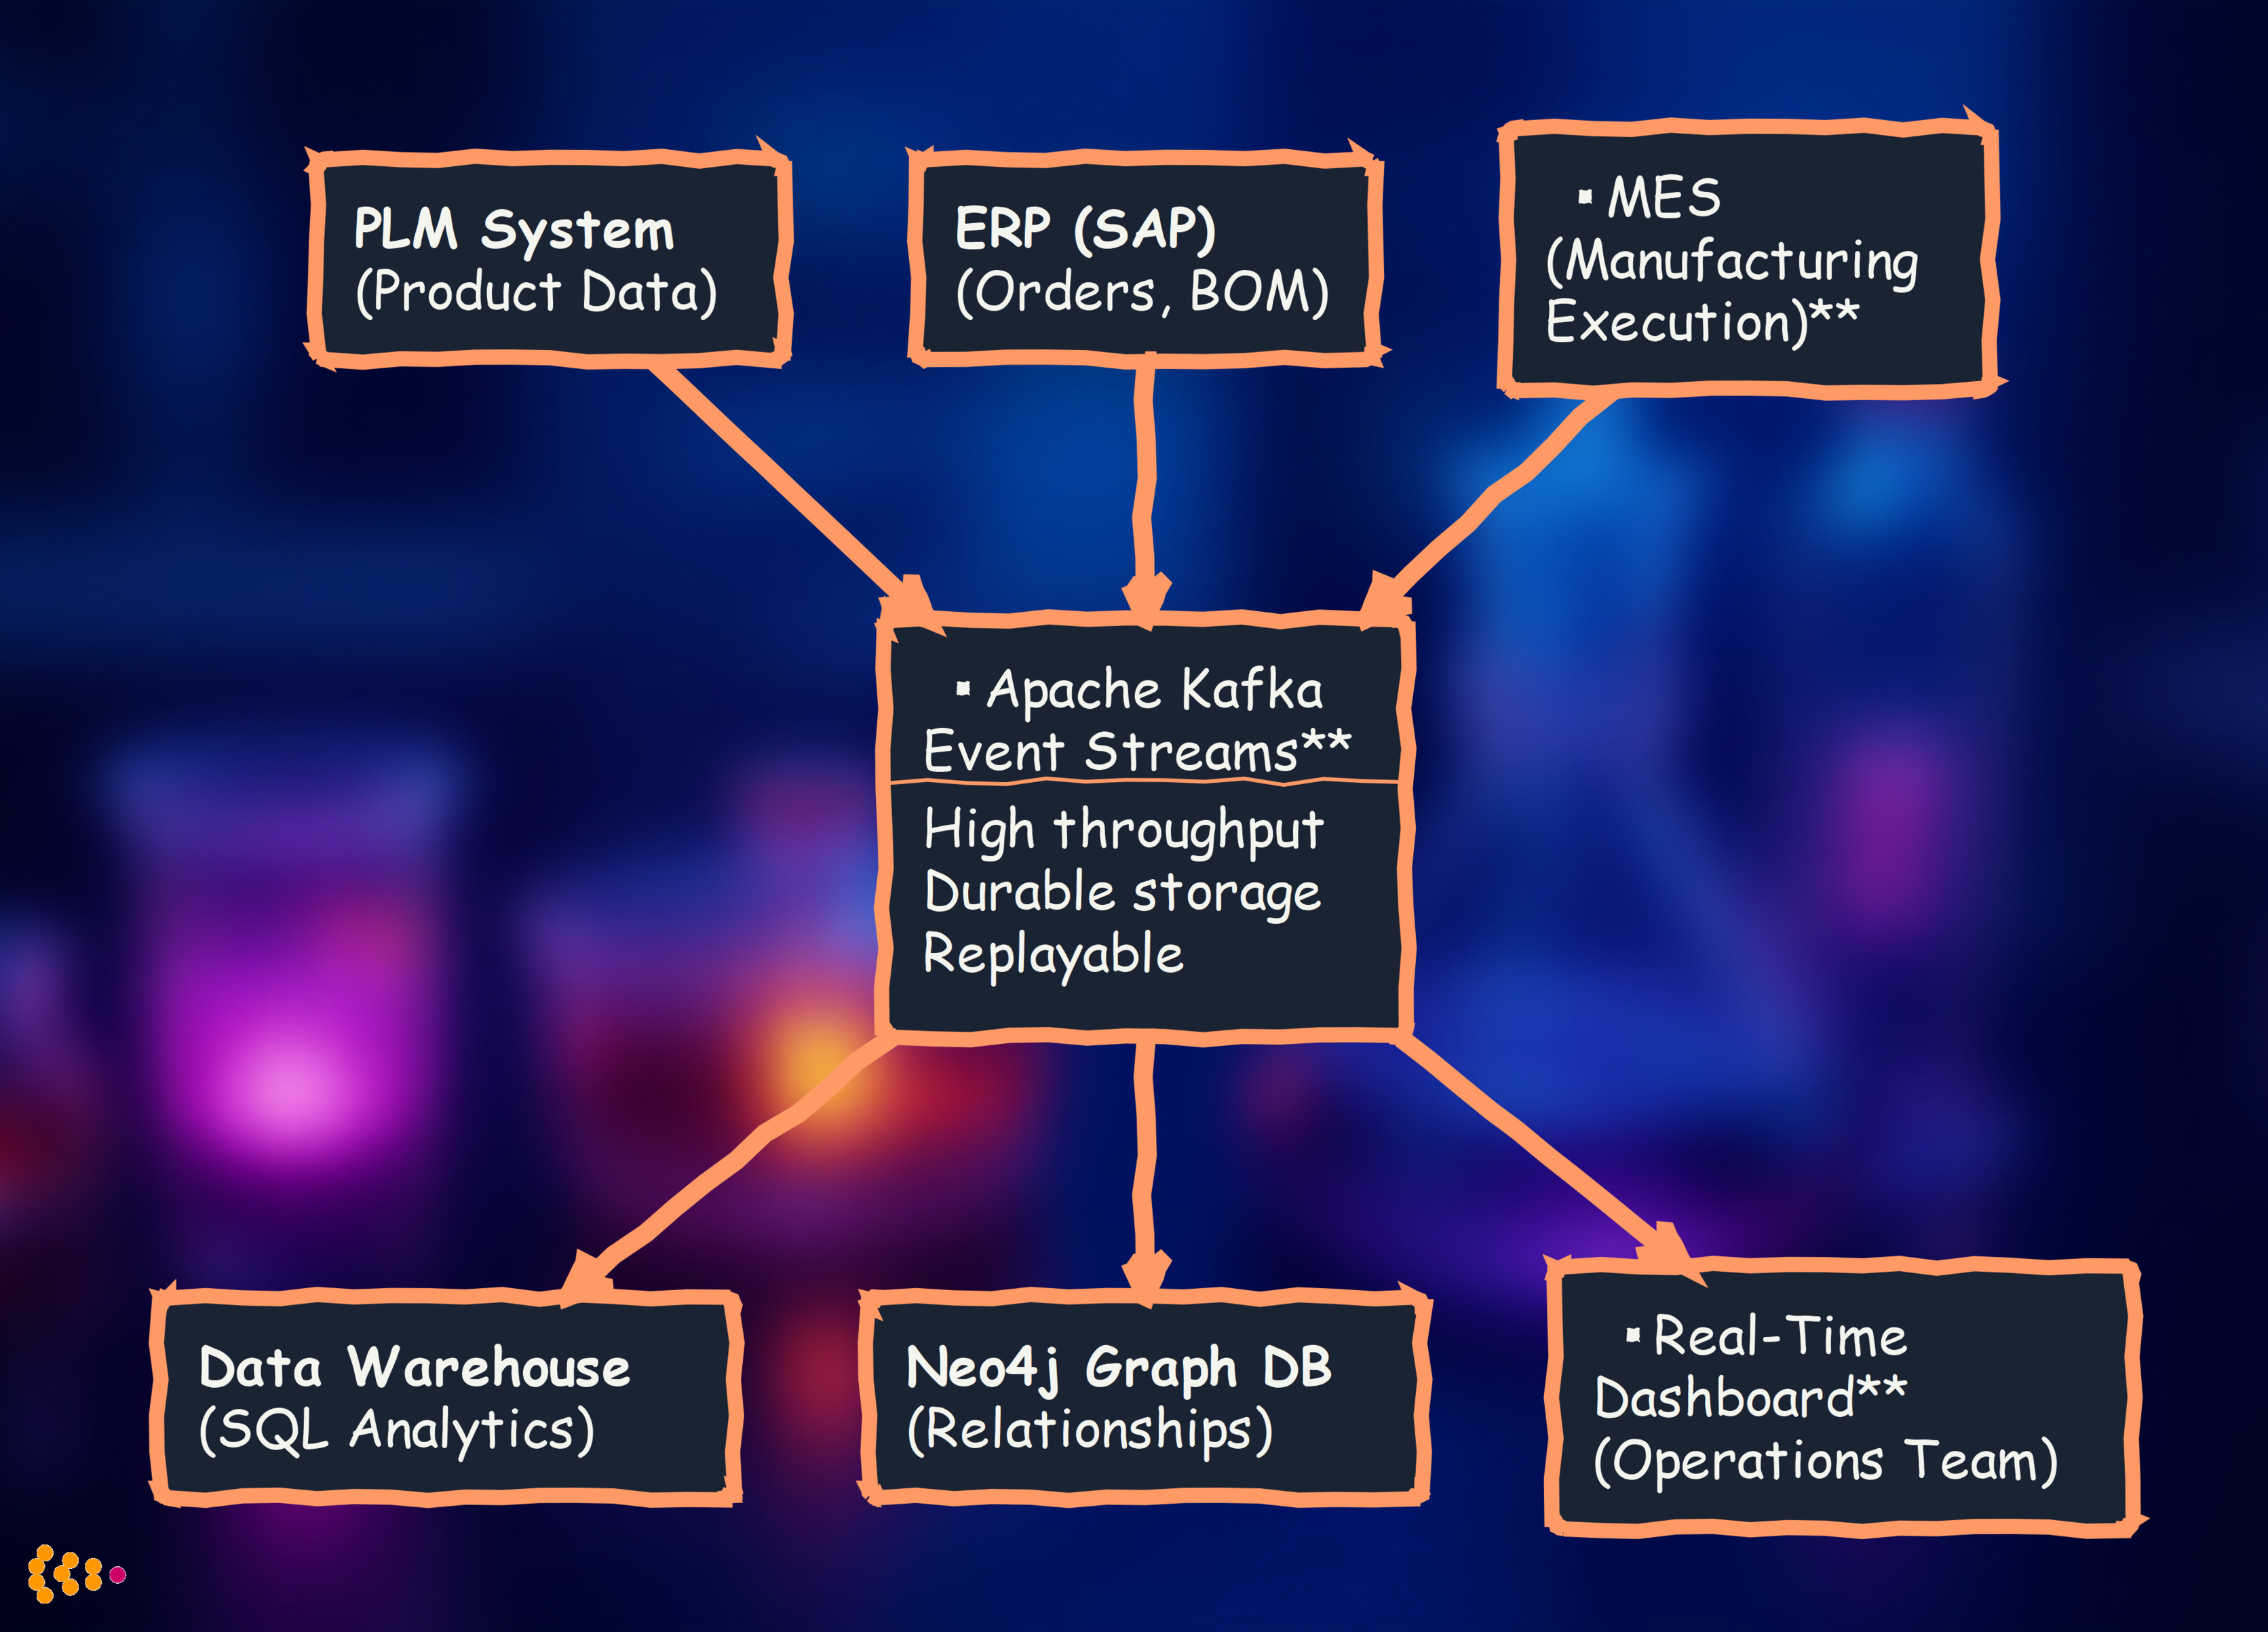
We built a central event-driven data hub where all systems publish and consume events in real-time.
What gets streamed:
- Part master data updates (from PLM)—consumed by ERP, manufacturing, data warehouse
- Production events (from MES)—consumed by dashboards, quality systems, supply chain planning
- Quality reports (from QMS)—consumed by engineering, supplier management, analytics
- Supply chain events (from ERP)—consumed by production planning, procurement dashboards
Architecture Overview
Example Results
1. Latency Reduction
- Before: Overnight batch ETL delay
- After: Near real-time propagation from source event to all consumers
- Impact: Decisions based on current reality, not outdated data
Example: When supplier reports disruption, procurement sees it in ERP immediately, production planning dashboard updates automatically, alternative sourcing workflow triggers instantly.
2. Operational Agility
Supply chain disruption scenario:
- Supplier reports delay for brake components
- Kafka event immediately consumed by:
- Production planning system (adjusts schedule)
- Neo4j graph database (finds affected vehicles)
- Alert system (notifies plant managers)
- Plant manager quickly prioritizes different vehicle models that don’t need those brake components
- Result: Production continues with minimal disruption
Before Kafka: This would have taken much longer, potentially resulting in production line stoppage.
3. System Scalability
- Before: Adding new quality analytics system required modifying multiple existing integrations
- After: New system subscribes to Kafka topics—zero changes to existing systems
- Impact: Faster time-to-value for new capabilities
4. Inventory Optimization
Real-time production events trigger just-in-time replenishment:
- Before: Safety stock buffers to handle data lag (high carrying costs)
- After: Real-time consumption triggers orders when actually needed
- Result: Reduced inventory carrying costs
Actual Project: Geometry Data Streaming Architecture
Project Context
Since 2023, we’ve implemented Apache Kafka streaming topics for real-time data synchronization across automotive engineering systems.
Streaming Architecture
1. Populating Neo4j Graph Database
Kafka topics stream data from the Geometry Master Database to Neo4j:
- Virtual vehicle structure updates
- Part positioning information changes
- Administrative hierarchy modifications
- Change history events
Benefits: Neo4j graph database stays synchronized with the authoritative geometry data source in real-time, enabling immediate analysis in the vehicle comparison application.
2. Generic Analytics Data Hub
The same Kafka topics feed a generic analytics data hub, providing:
- Centralized data for cross-system analytics
- Historical tracking for trend analysis
- Data warehouse population for business intelligence
3. Partner System Integration
Kafka topics enable bi-directional data flow with partner systems:
Outbound: Geometry Master Database publishes changes to partner systems
- Engineering systems receive part updates
- Manufacturing systems get structure changes
- Quality systems track component modifications
Inbound: Partner systems publish updates back to maintain pool tables in Geometry Master Database
- Ensures data consistency between engineering systems
- Prevents data drift across distributed architecture
- Maintains single source of truth while enabling distributed operations
Value Delivered
- Real-time synchronization: All systems work with current data
- Data consistency: Pool tables ensure engineering systems stay aligned
- Decoupled architecture: Systems communicate through Kafka, not point-to-point
- Scalability: New systems can subscribe to existing topics without disrupting current integrations
- Resilience: Kafka durability ensures no data loss during system outages
Combining Neo4j and Kafka: The Power Duo
The most powerful architecture combines both technologies:
Kafka streams events → Neo4j graphs relationships
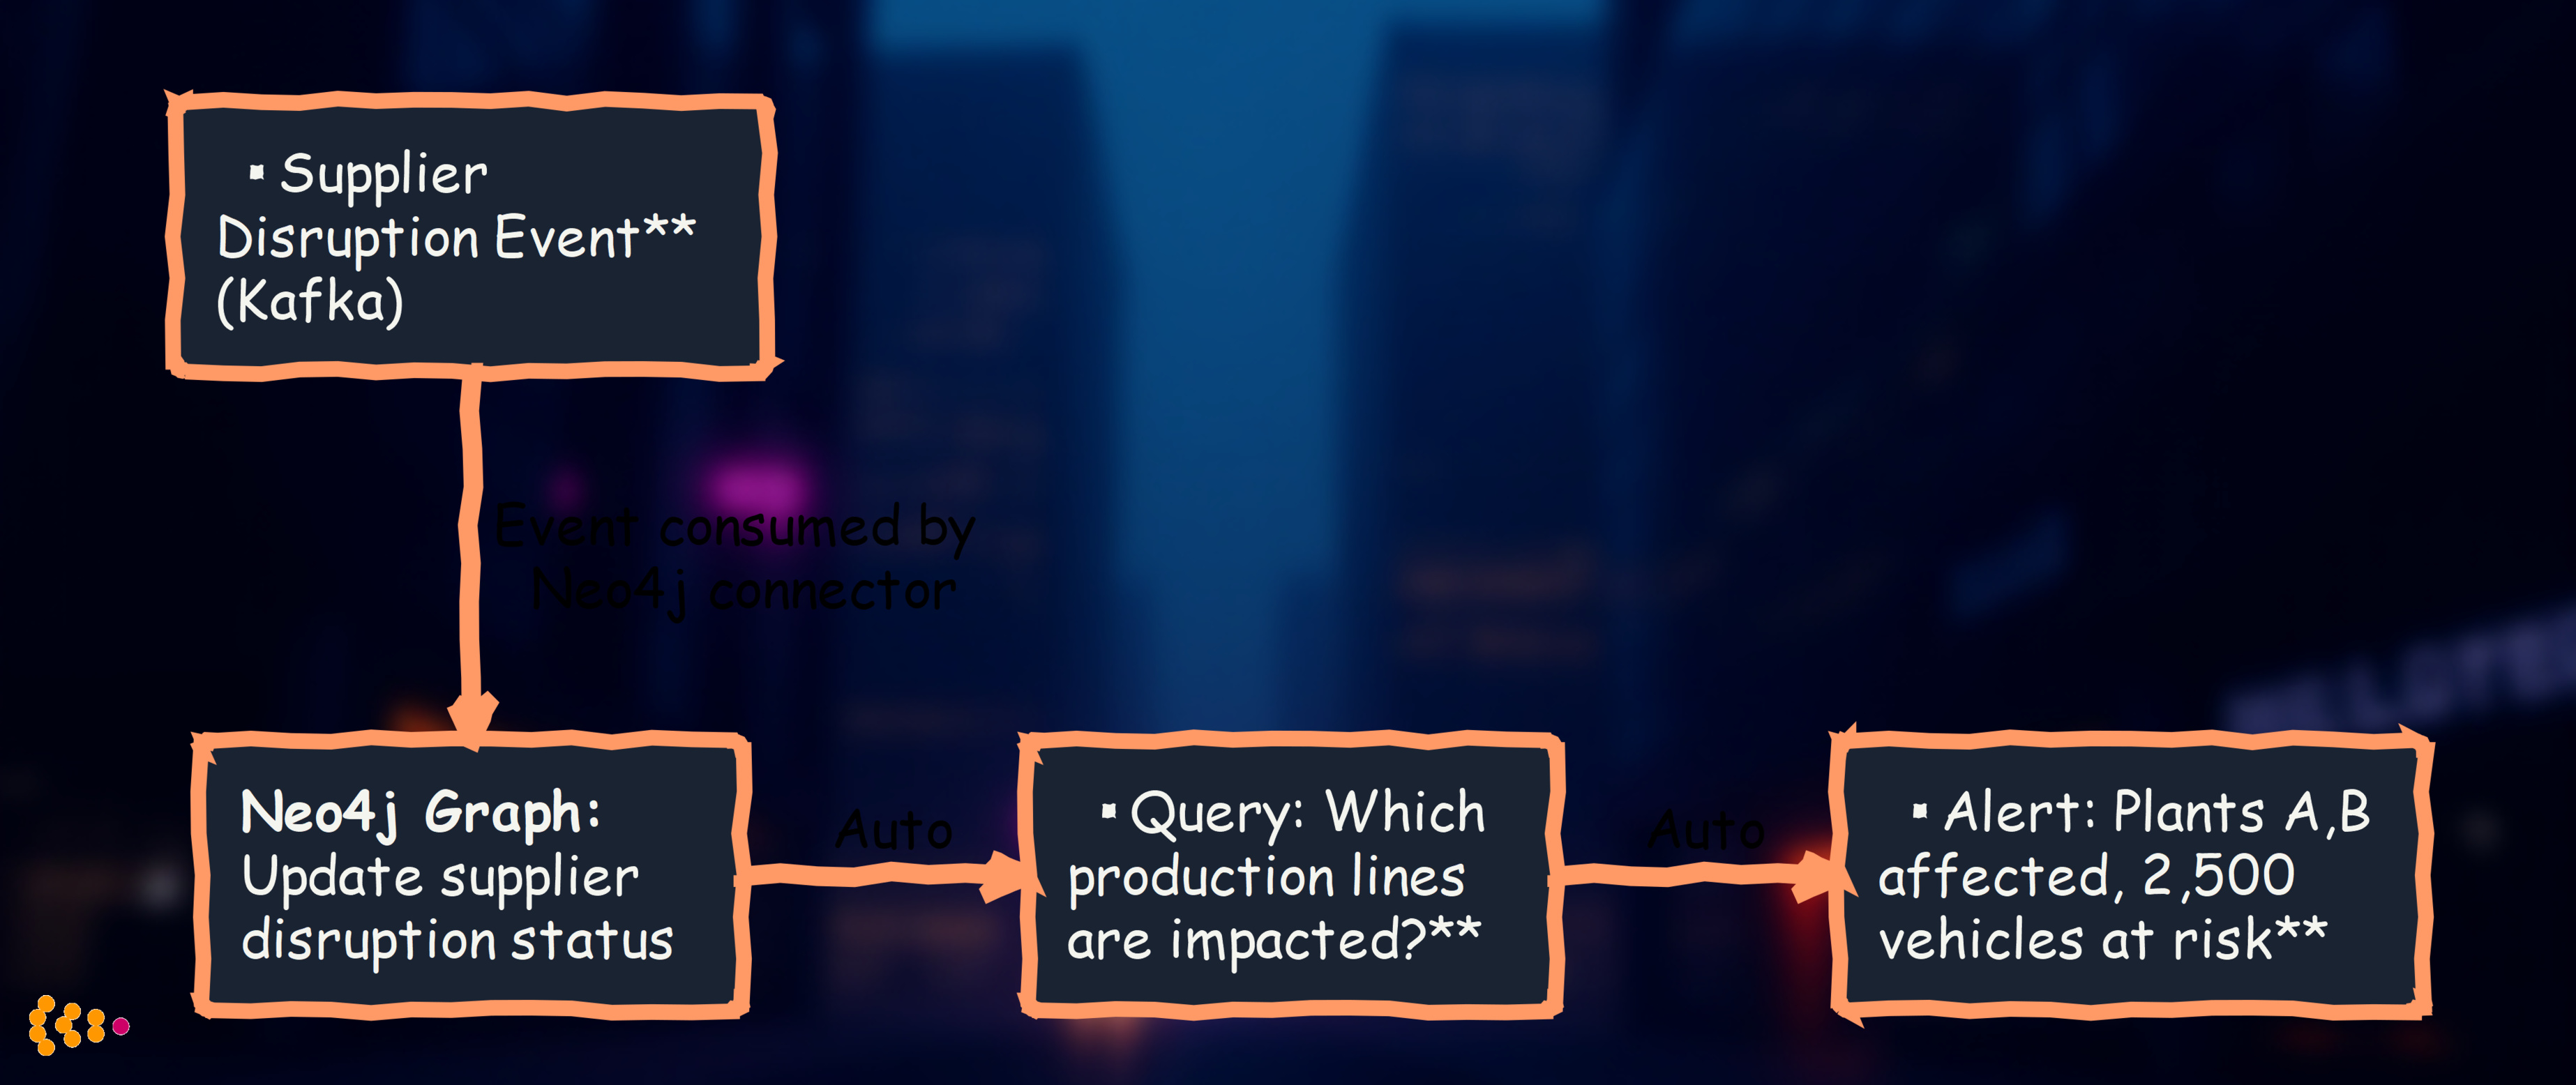
Real-world use case: Supply chain impact analysis
- Supplier reports disruption (publishes Kafka event)
- Kafka connector updates Neo4j graph with disruption relationship
- Neo4j automatically runs graph query: “Which parts → assemblies → vehicles → plants are affected?”
- Alert system notifies production planners with specific impact (which plants, which vehicles)
- Total time: Near-instant from supplier notification to production team alert
Before this architecture: Required extensive manual analysis across multiple systems.
Lessons Learned from Production Deployments
Graph Databases (Neo4j)
✅ What Works:
- Start with clear business questions: “What needs to be connected?” drives graph design
- Visual exploration: Business users love seeing their data as a graph—increases adoption
- Iterative modeling: Easy to add new relationship types as use cases emerge
- Performance: Significantly faster than SQL for multi-hop relationship queries
❌ Common Pitfalls:
- Over-engineering: Don’t model everything as a graph—use it for relationship-heavy domains
- Data quality: Garbage in, garbage out—invest in clean master data feeds
- User training: Graph thinking is different—plan for adoption curve
Apache Kafka
✅ What Works:
- Event-driven mindset: Think “what happened?” not “what’s the current state?”
- Schema management: Invest in schema registry from day one—prevents breaking changes
- Monitoring: Track consumer lag to detect issues before they impact business
- Retention: Keep events for extended periods—enables debugging and system rebuilds
❌ Common Pitfalls:
- Wrong granularity: Too many topics creates complexity; too few creates coupling
- No governance: Without clear ownership, topics proliferate uncontrollably
- Underestimating volume: Plan for significant growth—Kafka scales but infrastructure costs matter
- Ignoring order guarantees: Kafka guarantees order within a partition, not across partitions
When to Use These Technologies
Use Neo4j When:
- Relationship queries dominate: “Who’s connected to whom?” questions are common
- Multi-hop traversals: Need to explore 3+ levels deep in relationships
- Dynamic schema: Relationship types evolve as business needs change
- Visual exploration: Business users benefit from seeing/navigating data graph
Good domains: Supply chains, product structures, organizational hierarchies, knowledge graphs, fraud detection networks
Not ideal for: Simple CRUD applications, pure transactional workloads, time-series data
Use Kafka When:
- Real-time synchronization: Multiple systems need current data
- Event-driven processes: Business workflows triggered by events
- System decoupling: Want to add/remove systems without breaking existing integrations
- Audit trails: Need durable log of all state changes
Good use cases: Enterprise data hubs, IoT telemetry, microservices communication, ETL pipelines, change data capture
Not ideal for: Request-response patterns, sub-millisecond latency requirements, small-scale single-system applications
Future Directions
Graph Machine Learning: Using Neo4j’s Graph Data Science library for predictive analytics—which parts will fail together, which suppliers are most critical to operations
Federated Graphs: Connecting Neo4j instances across regions for global visibility while respecting data residency regulations
Event-Driven Everything: Expanding beyond data synchronization to event-driven business processes (quality issues automatically trigger supplier audits)
Real-Time Digital Twins: Streaming vehicle telemetry from connected cars into graph databases for predictive maintenance and usage analysis
Conclusion
Modern business problems require modern data architectures:
- Neo4j excels at relationship questions: “What’s connected?” “What’s the impact?” “How are things related?”
- Kafka enables real-time operations: “What’s happening now?” “Keep all systems synchronized” “React to events instantly”
Together, they transform how organizations understand and operate their businesses—from batch reports of yesterday’s state to real-time insights driving today’s decisions.
Since 2023, these technologies have delivered substantial value for our automotive and industrial clients through:
- Significantly faster relationship queries vs. traditional databases
- Near real-time data synchronization replacing overnight batch delays
- Improved inventory management through real-time supply chain visibility
- Better decision-making through targeted analysis instead of broad assumptions
Technologies Used: Neo4j Enterprise, Apache Kafka, Kafka Connect, Kafka Streams, Apache NiFi, Dassault Enovia, SAP, GraphQL
About: HSEC has been architecting data platforms and integration solutions since 2006, with deep expertise in automotive and industrial domains. We’ve deployed Neo4j graph databases and Kafka streaming platforms in production environments handling billions of events and relationships.
Contact: Ready to explore graph databases or streaming data architectures for your organization? Get in touch.