Analytics & Data Science: Multi-Platform Expertise for Enterprise Insights
Introduction
In today’s data-driven business environment, extracting actionable insights from vast amounts of information requires more than just collecting data—it demands sophisticated analytics capabilities, robust data integration, and the right tools for each analytical challenge.
Over the past 15+ years, we’ve built analytics solutions across diverse industries and platforms. Our approach combines:
- Data lake and hub integration to consolidate enterprise data sources
- Multi-platform analytics expertise (Python, R, RapidMiner, MATLAB, Octave)
- Custom analytics software tailored to specific business domains
- Data quality assurance through outlier detection and validation
- Automotive metadata analytics for engineering data insights
- Market research analytics for consumer behavior understanding
This article shares our real-world experience building analytics capabilities that deliver measurable business value.
The Analytics Technology Landscape
Different analytical challenges require different tools. We’ve developed expertise across the full spectrum:
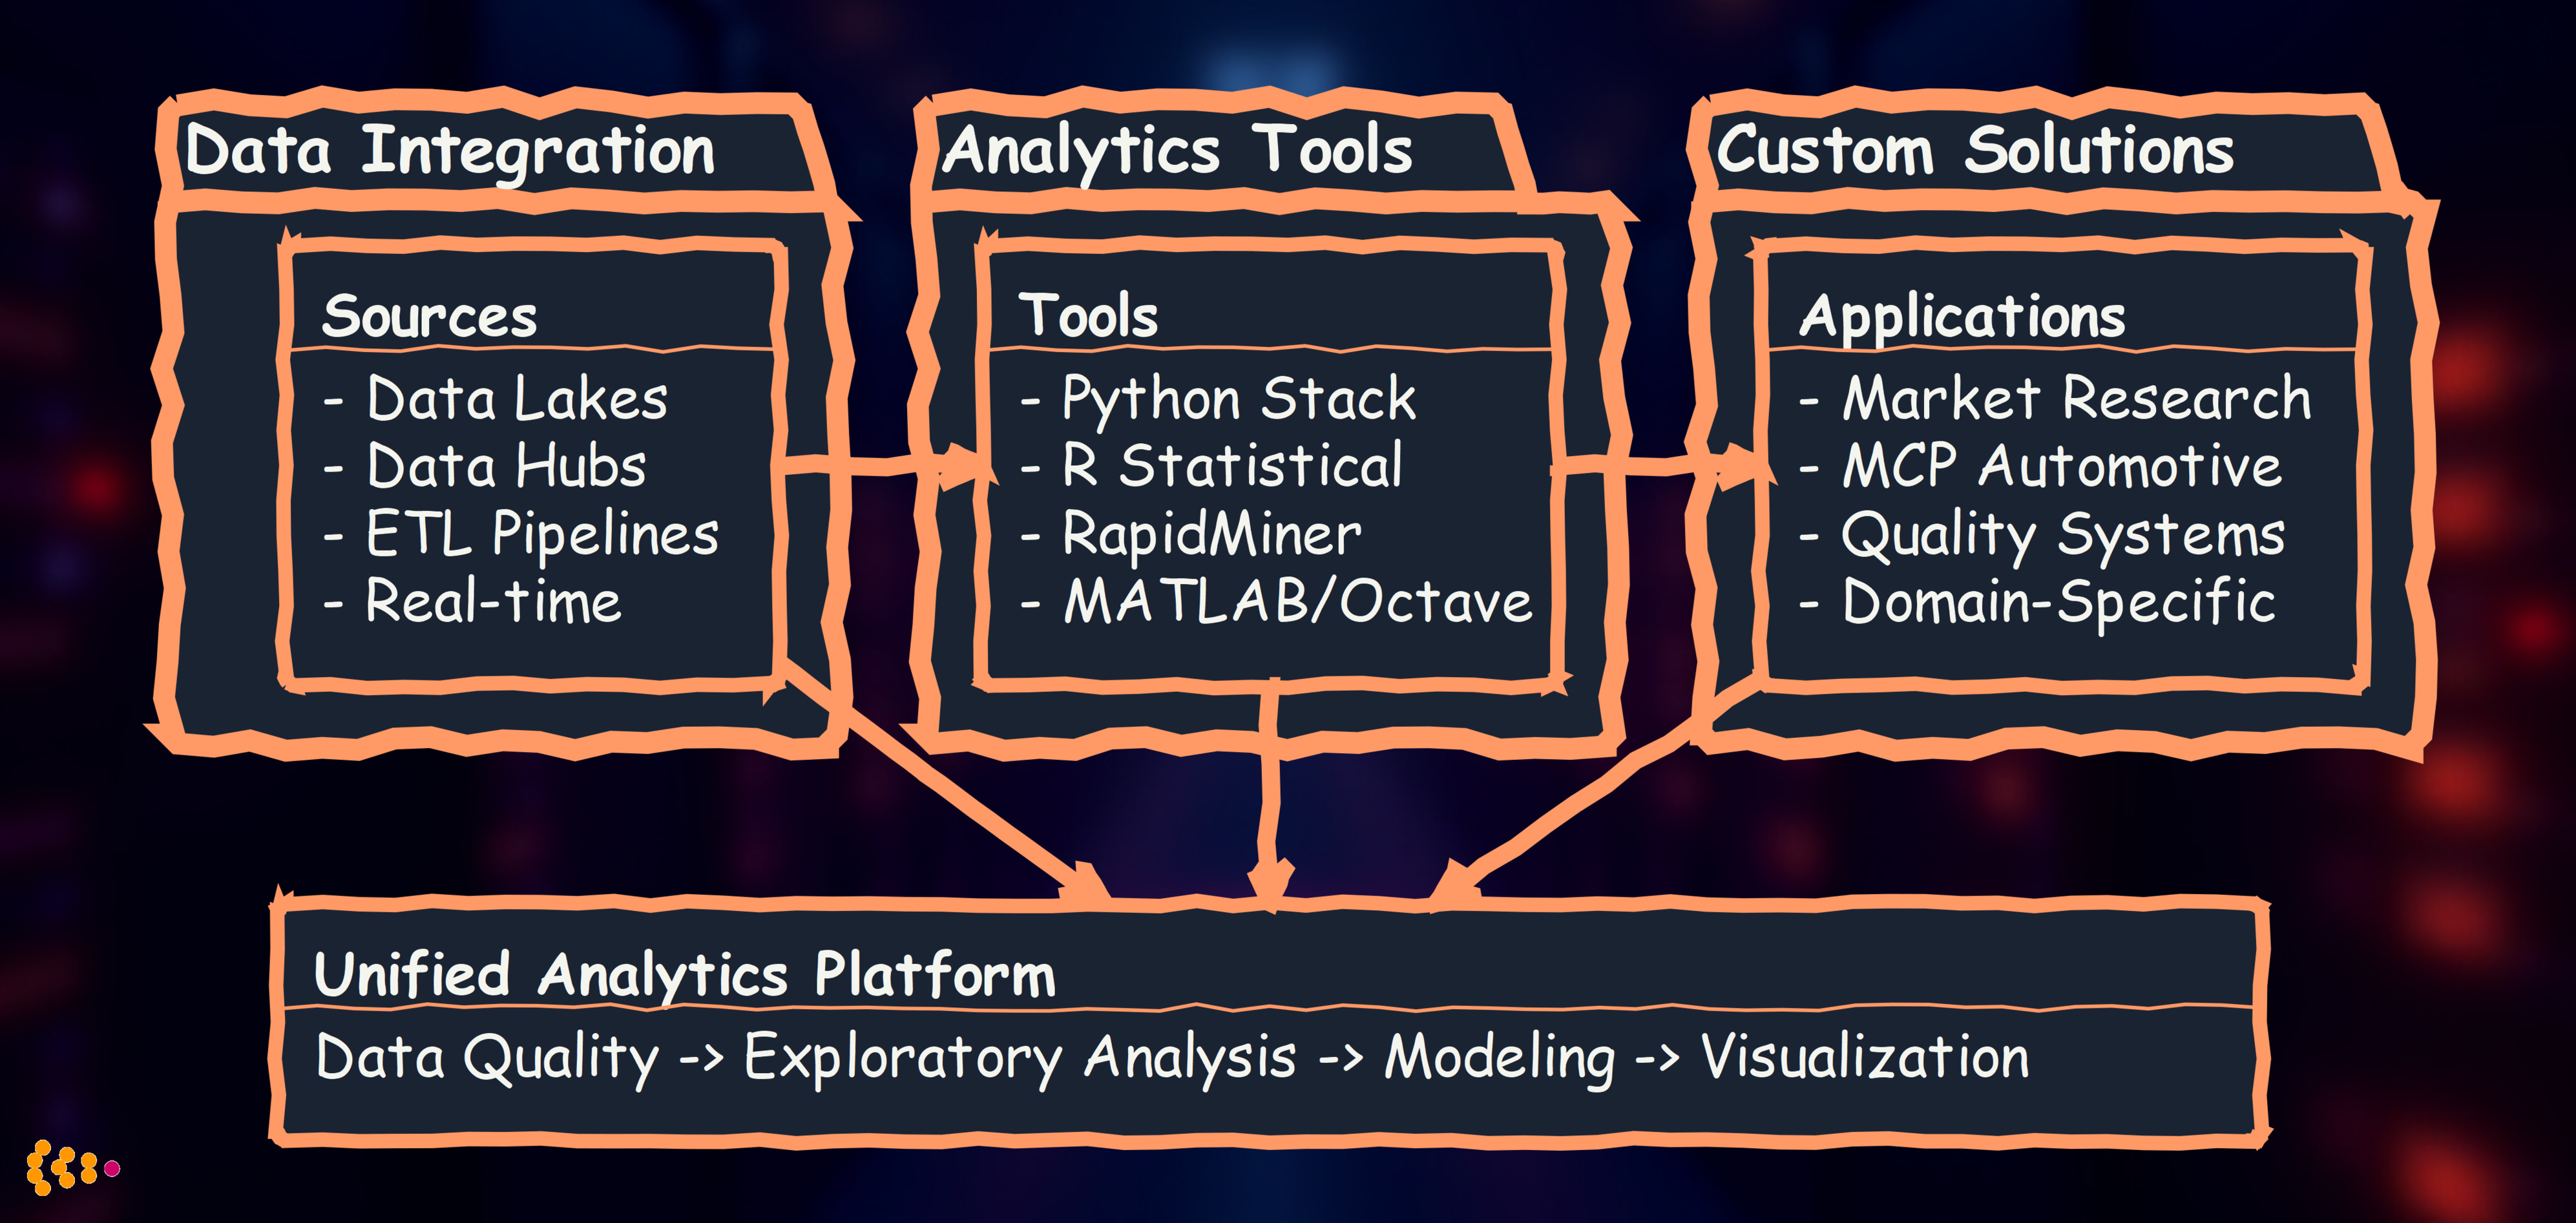
Philosophy: Choose the right tool for the job, not the most fashionable one.
Project Experience 1: Data Lake Integration for Multi-Source Analytics
Business Challenge
A global automotive manufacturer operated with fragmented data across 15+ systems:
- SAP for ERP and supply chain
- Dassault Enovia for PLM and CAD metadata
- Custom quality management systems
- Manufacturing execution systems (MES)
- Market research databases
- Customer feedback platforms
Problem: Analysts spent 60-70% of their time finding and preparing data, leaving only 30% for actual analysis. Business questions requiring cross-system insights took weeks to answer.
Our Solution: Unified Data Hub Architecture
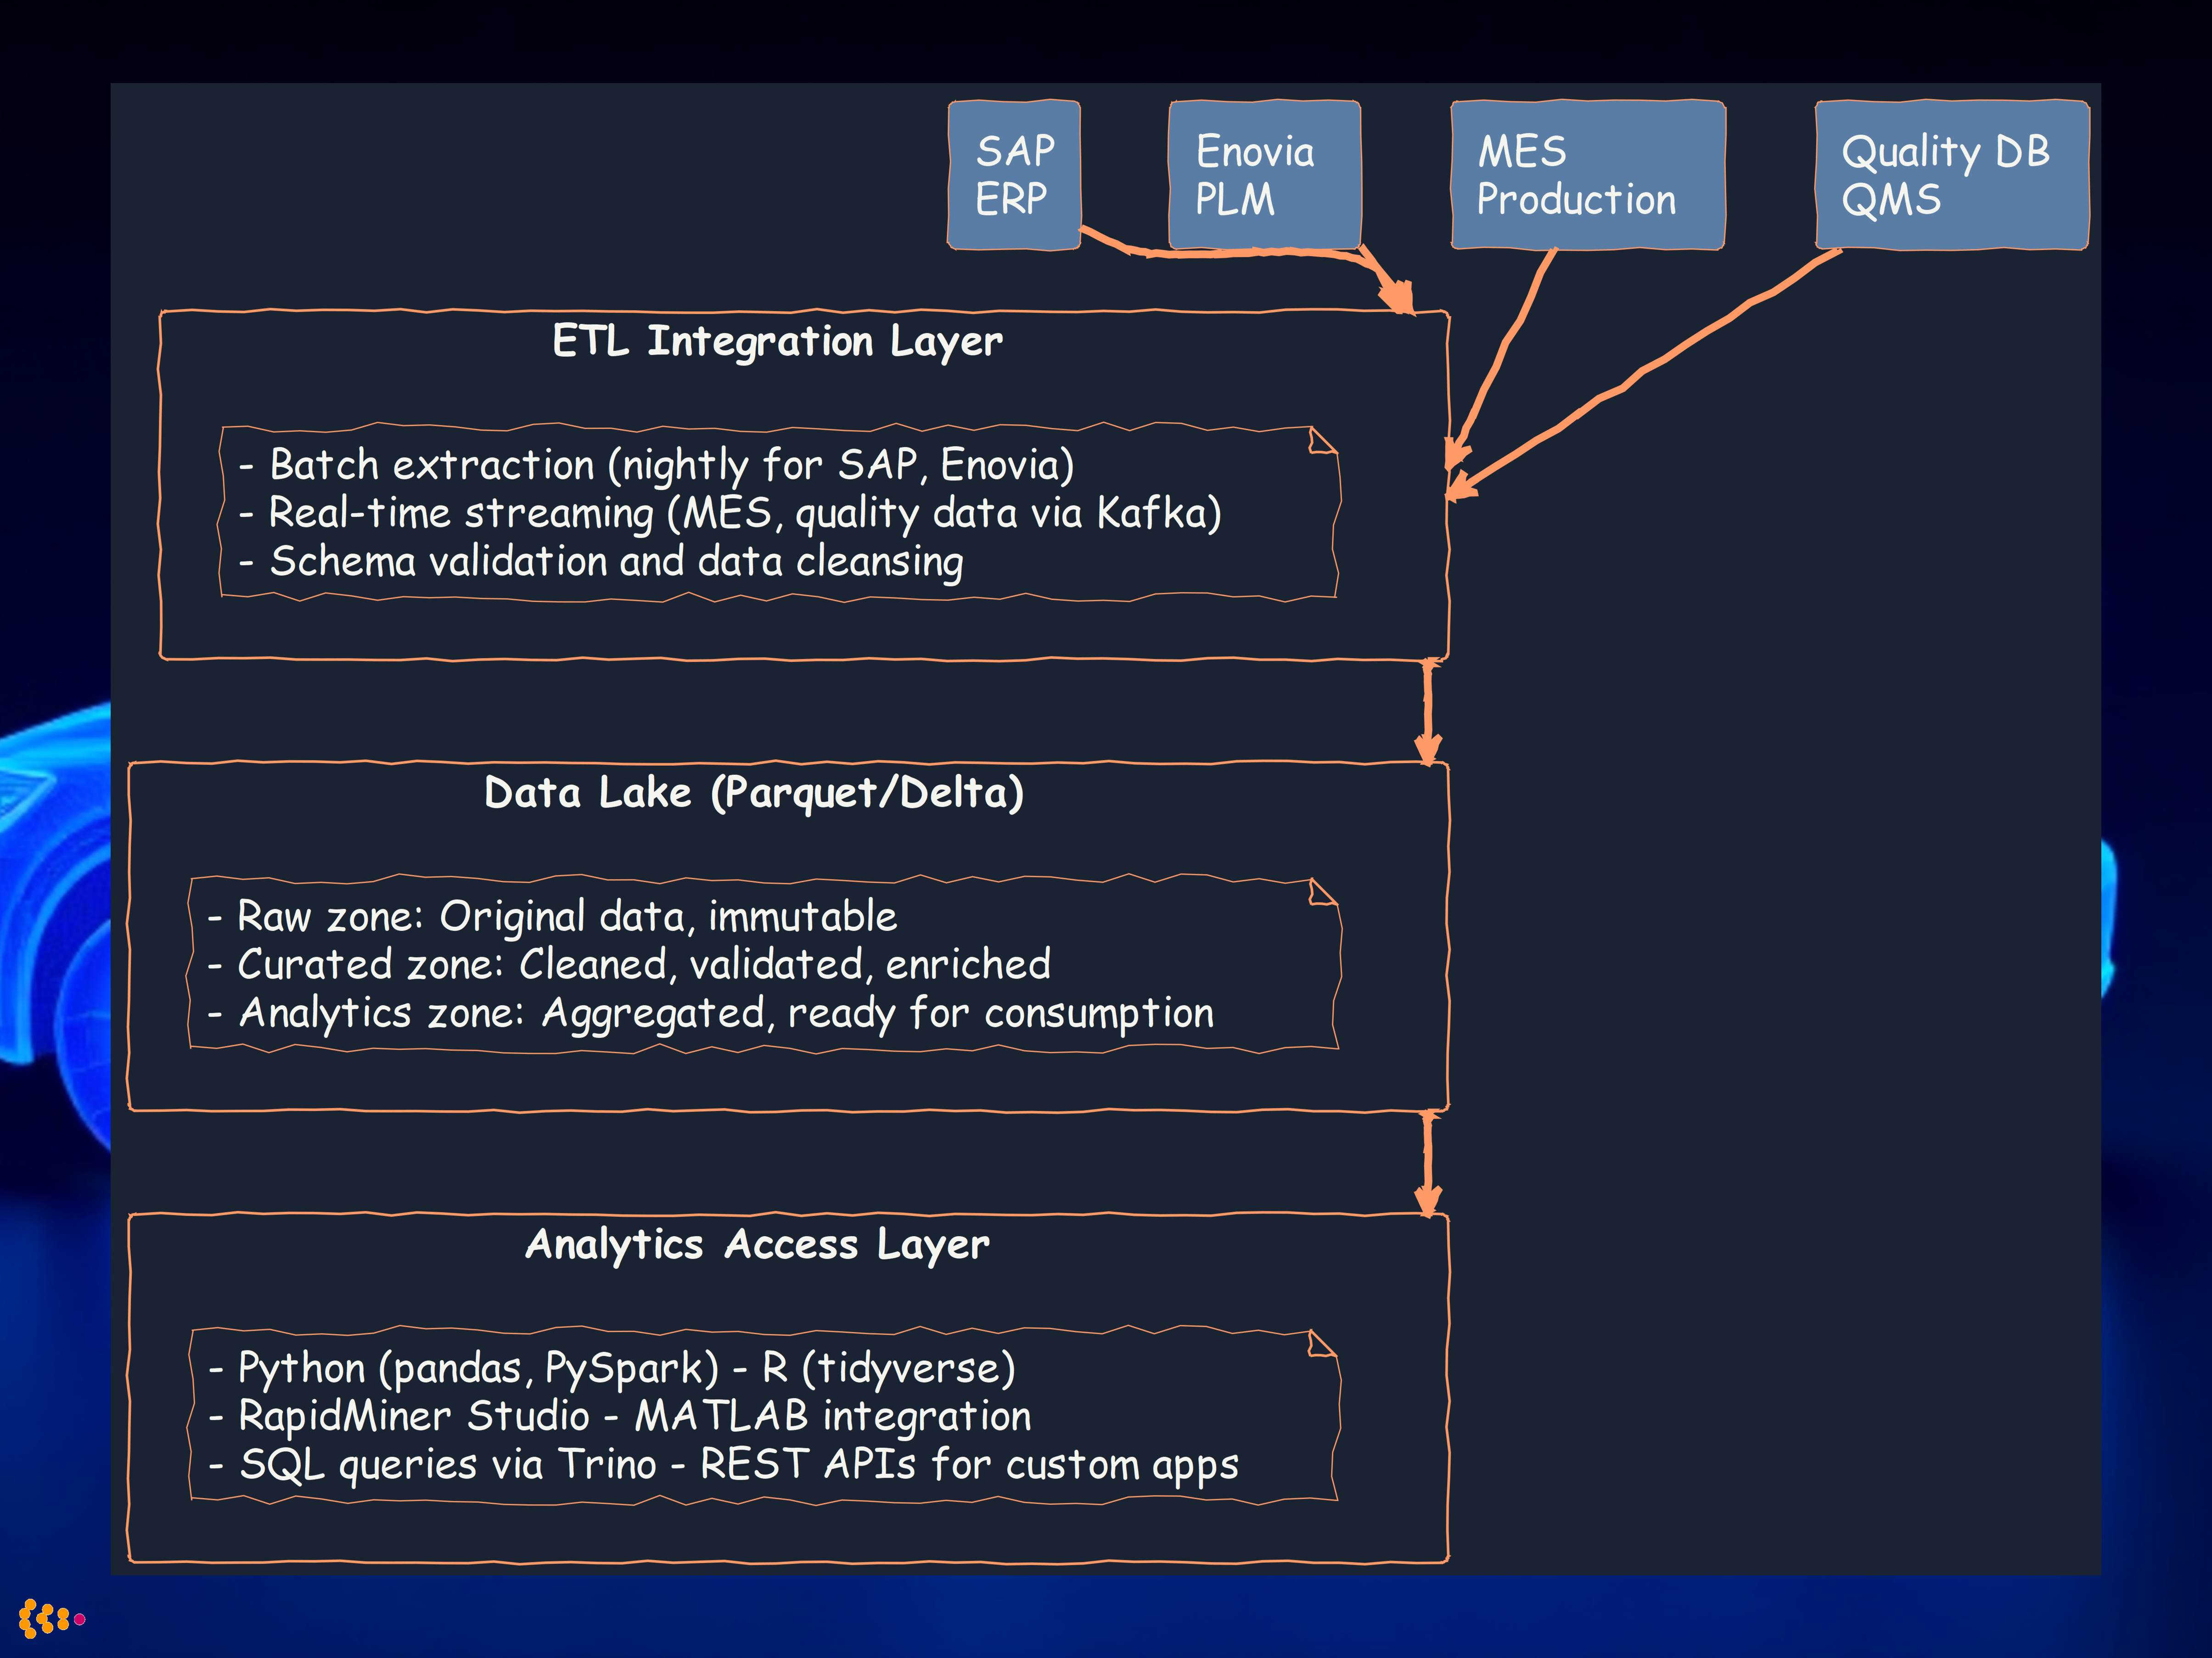
We designed and implemented a central data hub with data lake capabilities:
Key Technical Decisions
1. Storage Format: Apache Parquet with Delta Lake
- Why: Columnar format optimized for analytics queries
- Benefit: 10x faster query performance vs. row-based storage
- Delta Lake: ACID transactions, time travel for data versioning
2. ETL Strategy: Hybrid Batch + Streaming
- Batch: Nightly extraction for SAP, Enovia (large volumes, acceptable latency)
- Streaming: Real-time for MES, quality data (Kafka + Spark Structured Streaming)
- Benefit: Balance between performance and data freshness
3. Multi-Tool Access
- Python data scientists preferred pandas and scikit-learn
- Statistical analysts needed R for specialized packages
- Business analysts used RapidMiner for visual workflows
- Engineers required MATLAB for signal processing on sensor data
Outcomes
- 70% reduction in data preparation time (from 3 days to <1 day for typical analysis)
- Single source of truth for cross-functional analytics
- Real-time quality dashboards (MES + quality data streamed live)
- Self-service analytics for business users via RapidMiner
- $2.5M annual savings from faster decision-making and reduced manual data work
Project Experience 2: Python-Based Analytics Platform
The Python Data Science Stack
For most enterprise analytics tasks, the Python ecosystem provides unmatched breadth and depth:
Our standard Python stack:
# Data manipulation and analysis
import pandas as pd
import numpy as np

# Statistical modeling
from scipy import stats
from statsmodels.api import OLS

# Machine learning
from sklearn.ensemble import RandomForestClassifier, GradientBoostingRegressor
from sklearn.preprocessing import StandardScaler
from sklearn.model_selection import cross_val_score

# Visualization
import matplotlib.pyplot as plt
import seaborn as sns
import plotly.express as px

# Big data processing
from pyspark.sql import SparkSession
from pyspark.ml import Pipeline
Use Case: Predictive Maintenance Analytics
Challenge: Automotive supplier needed to predict equipment failures before they occurred, minimizing unplanned downtime.
Data sources:
- Sensor data from 500+ machines (temperature, vibration, pressure, current)
- Maintenance logs (repairs, part replacements)
- Production schedules
- Quality inspection results
Our Python-based solution:
Key features we implemented:
-
Feature engineering with pandas:
- Rolling statistics (7-day, 14-day, 30-day windows)
- Trend analysis (temperature/vibration increasing?)
- Time-since-last-maintenance features
- Interaction features (temperature × vibration)
-
Ensemble modeling with scikit-learn:
- Random Forest for feature importance analysis
- Gradient Boosting for prediction accuracy
- Isolation Forest for anomaly detection
-
Real-time scoring with PySpark:
- Stream sensor data via Kafka
- Apply trained models in Spark Structured Streaming
- Generate alerts when failure probability >70%
Results:
- 45% reduction in unplanned downtime
- 92% prediction accuracy (7-day window)
- $1.8M annual savings from optimized maintenance scheduling
- Extended equipment lifetime by 15% through proactive care
Project Experience 3: RapidMiner for Business User Analytics
Why RapidMiner?
Not all analysts are Python programmers. RapidMiner provides visual workflow design for sophisticated analytics:
Strengths:
- Visual drag-and-drop interface (no coding required)
- Pre-built operators for data prep, modeling, evaluation
- Auto Model feature for automated machine learning
- Integration with databases, Python, R, Hadoop
Use Case: Customer Churn Prediction for Media Company
Challenge: International media group needed to predict subscriber churn to improve retention campaigns.
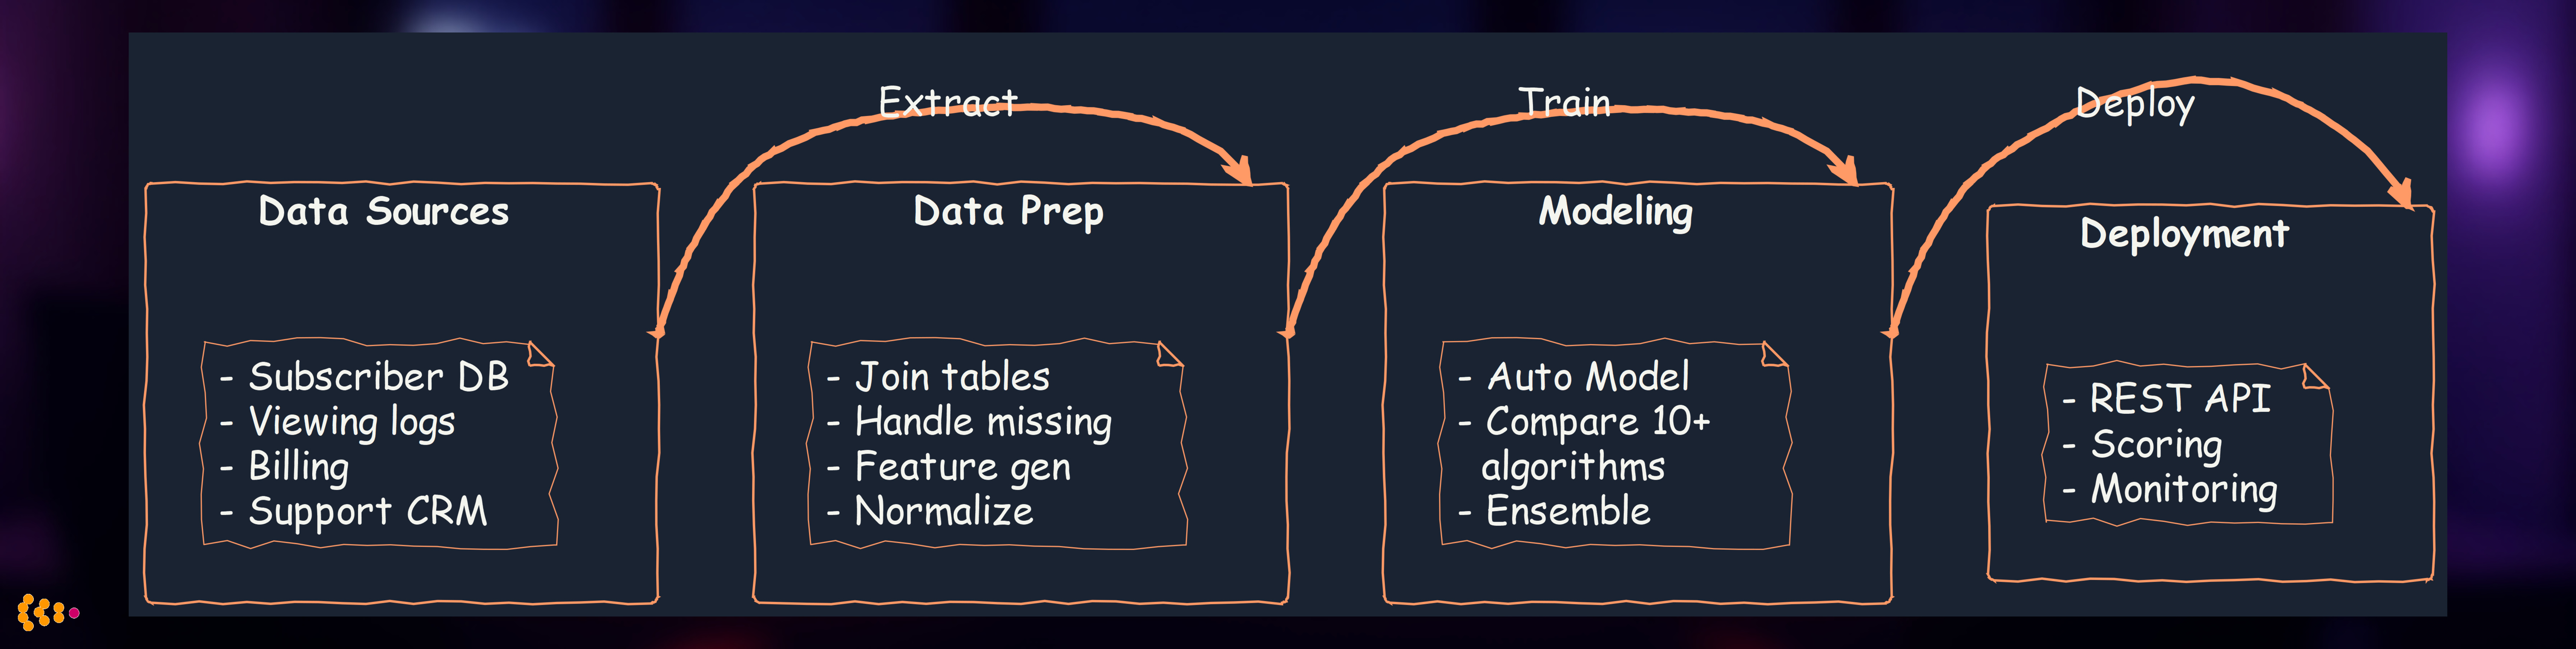
Data: 2.5 million subscribers, 120+ features (demographics, viewing behavior, billing history, support contacts)
Our RapidMiner workflow:
Key RapidMiner features we leveraged:
- Auto Model: Automatically tested 12 algorithms (decision trees, neural networks, SVM, etc.)
- Feature Selection: Identified top 20 predictive features from 120 candidates
- Model Deployment: Published model as REST API for CRM integration
- Business User Friendly: Marketing team could modify workflows without IT dependency
Results:
- Identified 85% of churners 30 days before cancellation
- Retention rate increased 22% through targeted campaigns
- ROI: 8:1 (campaign costs vs. retained subscription revenue)
- Business agility: Marketing team could test new features/campaigns independently
Project Experience 4: R for Advanced Statistical Analysis
When R is the Right Choice
R excels in specialized statistical domains:
- Advanced econometrics (time series forecasting, panel data models)
- Biostatistics (survival analysis, clinical trials)
- Bayesian statistics (MCMC, probabilistic modeling)
- Specialized packages (10,000+ CRAN packages vs. Python’s focused ecosystem)
Use Case: Market Research Analytics for Automotive Launch
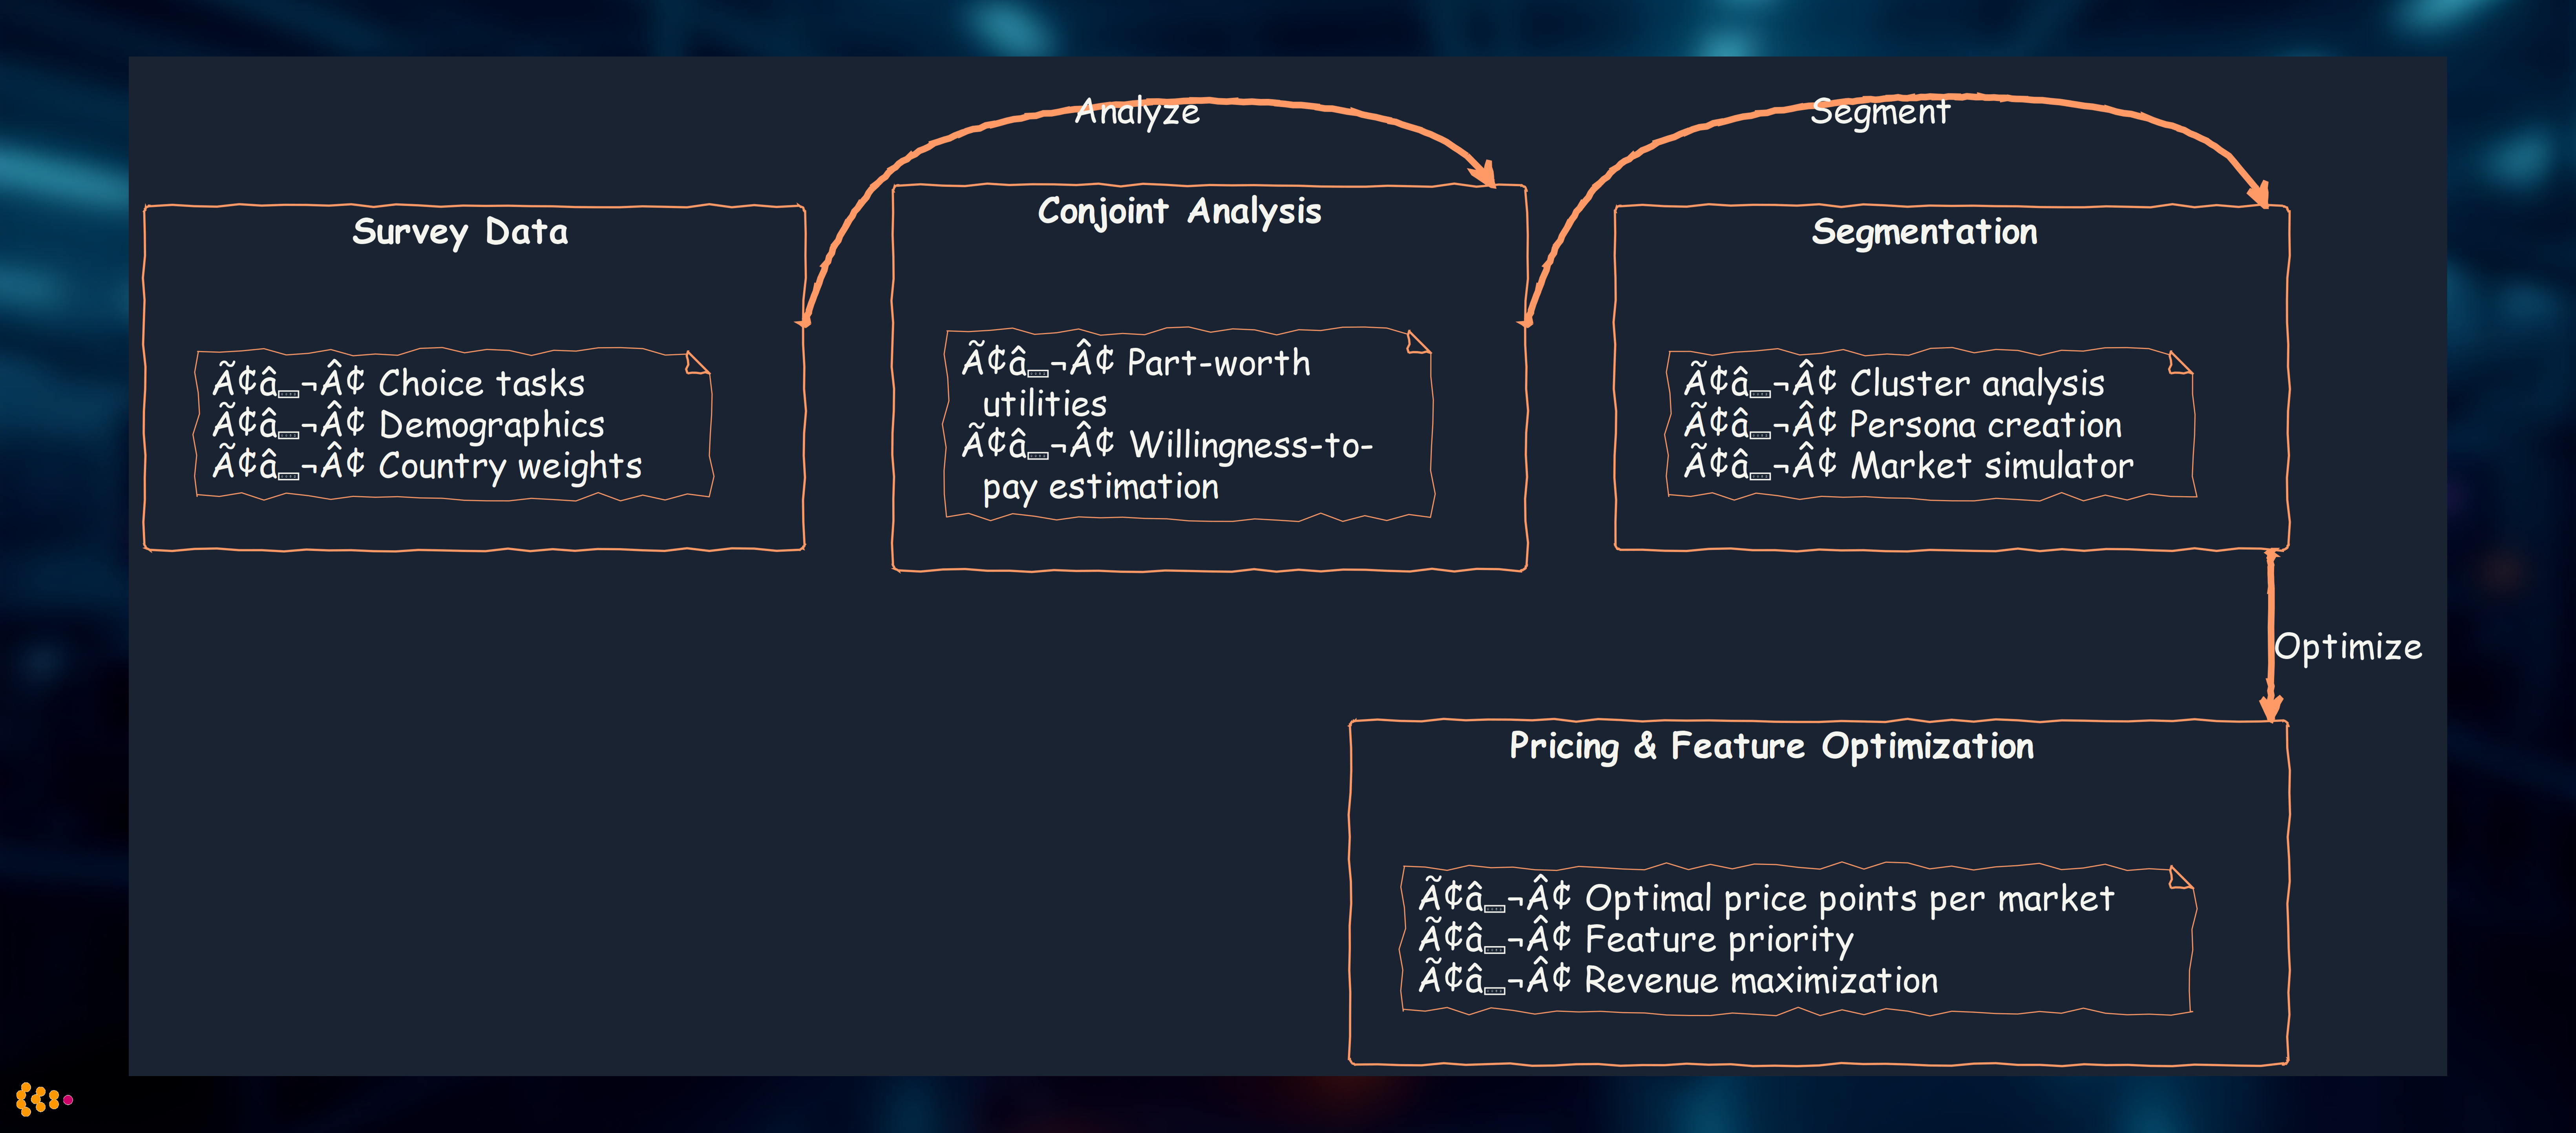
Challenge: Automotive OEM launching new EV platform needed to understand price sensitivity and feature preferences across European markets.
Data: Conjoint analysis survey data from 15,000 respondents across Germany, France, UK, Spain, Italy
Our R-based approach:
# Specialized packages for market research
library(tidyverse)      # Data manipulation
library(conjoint)       # Conjoint analysis
library(mlogit)         # Multinomial logit models
library(ggplot2)        # Visualization
library(survey)         # Complex survey design weighting

# Hierarchical Bayesian conjoint model
library(bayesm)
Analysis workflow:
Why R was essential:
- bayesm package: Hierarchical Bayesian conjoint models not available in Python
- Complex survey weighting: R’s survey package handles stratified sampling perfectly
- Market simulation: conjoint package’s built-in simulators for “what-if” scenarios
Results:
- Identified optimal price: €42,000 (Germany), €38,000 (France), £36,000 (UK)
- Feature priorities: Range >400km valued €8,000 more than 300-400km
- Market segmentation: 4 distinct buyer personas (eco-conscious, tech enthusiast, luxury seeker, value buyer)
- Launch strategy: Differentiated marketing by country and segment
- Revenue impact: €120M additional revenue in first year vs. uniform pricing strategy
Project Experience 5: Custom Analytics Software for Market Research
Beyond Off-the-Shelf: Domain-Specific Solutions
Sometimes no existing tool fits the specific business process. We’ve built custom analytics platforms for:
Use Case: Real-Time Market Research Panel Management
Challenge: Market research company managed 500,000-person panel, conducting 50+ studies per month. Needed real-time analytics to:
- Optimize panel recruitment (which demographics under-represented?)
- Prevent panel fatigue (identify over-surveyed respondents)
- Ensure data quality (detect speeders, straight-liners, bots)
- Maximize response rates (best time/channel to invite)
Our custom-built solution (Python + PostgreSQL + React):
Architecture:
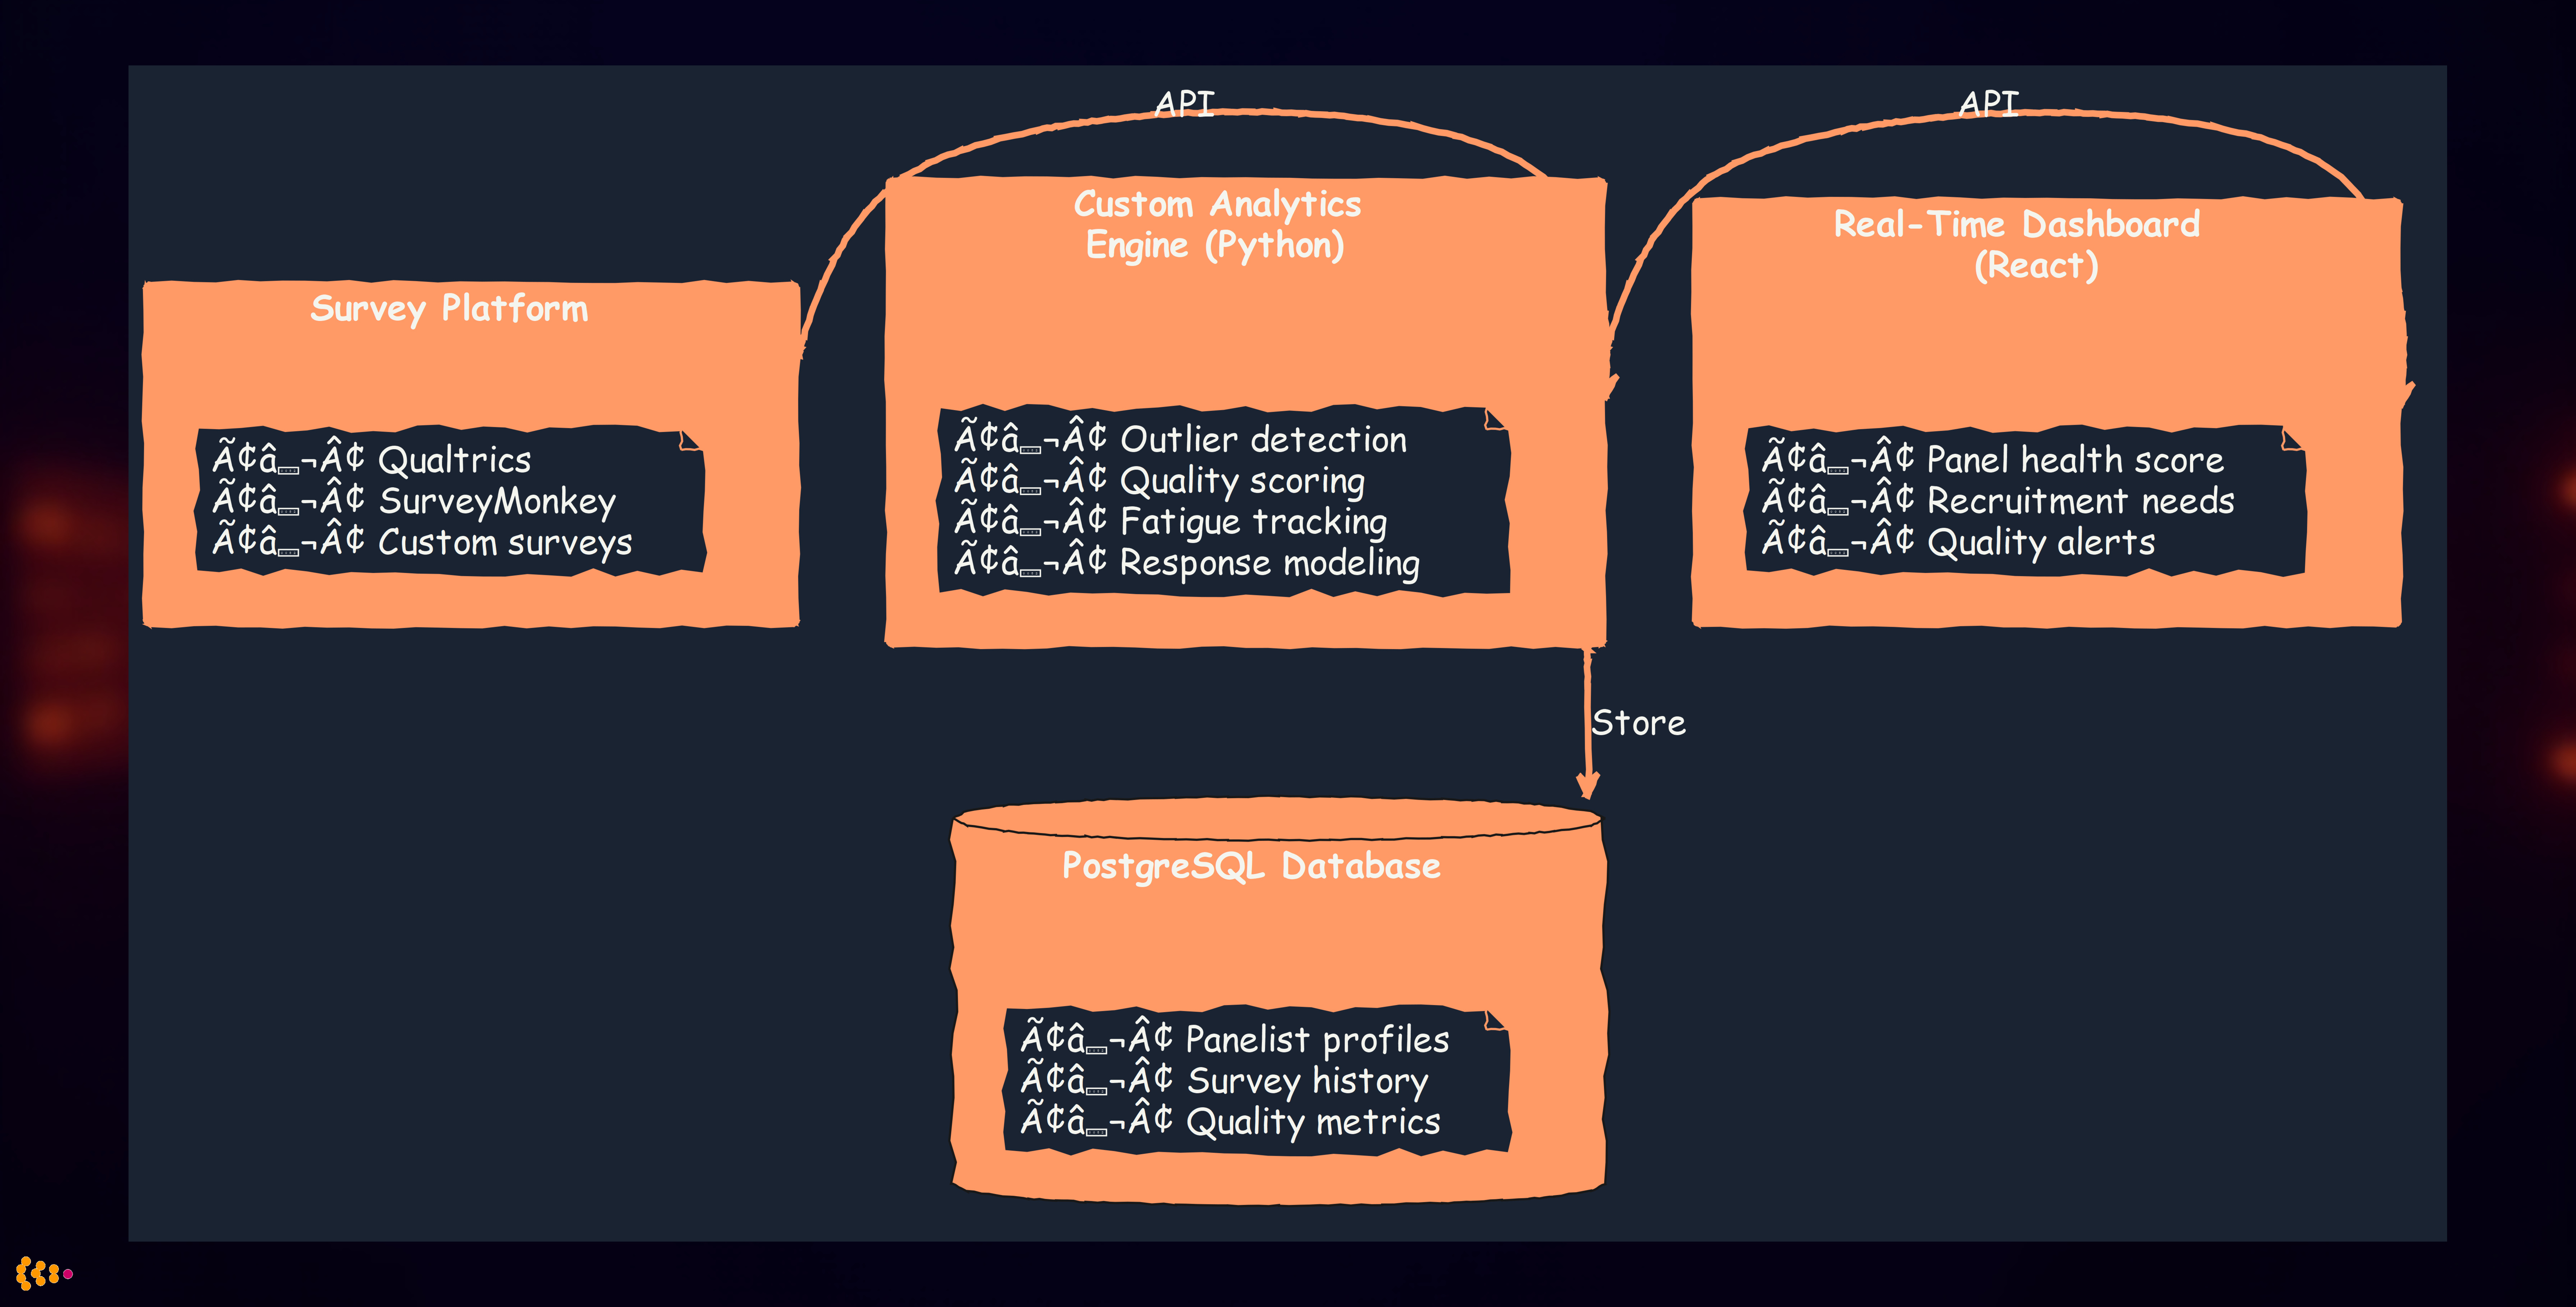
Custom analytics algorithms we implemented:
1. Outlier Detection for Data Quality
# Multi-dimensional quality scoring
def calculate_quality_score(response):
    """
    Composite quality score combining multiple indicators
    """
    # Speed check (completion time vs. expected)
    speed_score = detect_speeder(response.duration, response.question_count)

    # Pattern detection (straight-lining, zigzag patterns)
    pattern_score = detect_response_patterns(response.answers)

    # Attention check failures
    attention_score = evaluate_attention_checks(response.attention_items)

    # Open-end quality (gibberish, one-word answers)
    openend_score = evaluate_text_quality(response.text_answers)

    # Composite score (weighted)
    return (0.3 * speed_score + 0.3 * pattern_score +
            0.2 * attention_score + 0.2 * openend_score)
2. Fatigue Modeling
- Tracked survey invitations, responses, declines per panelist
- Predicted “burnout risk” using logistic regression
- Automatic quarantine of high-risk panelists for 30-90 days
3. Recruitment Optimization
- Real-time demographic gap analysis (need more males 18-25 in Spain)
- Predictive modeling of recruitment channel effectiveness
- Dynamic pricing for hard-to-reach demographics
Results:
- Response quality increased 35% (fewer speeders, better open-ends)
- Panel lifetime extended 28% through fatigue management
- Recruitment costs reduced 40% via optimized targeting
- Study completion times reduced 25% (faster recruitment of target demos)
Project Experience 6: MCP Analytics for Automotive Metadata
Model Context Protocol (MCP) for Engineering Data
Context: Automotive engineering generates vast metadata: CAD models, simulation results, test data, compliance documentation.
Challenge: Engineers needed to analyze relationships and patterns across:
- 50,000+ CAD parts (metadata: material, supplier, cost, weight)
- 10,000+ simulation runs (crash tests, aerodynamics, NVH)
- Test vehicle data (prototype testing across 20+ test types)
- Compliance documents (safety regulations, homologation)
Our MCP-Based Analytics Solution
What is MCP in this context?
- Model Context Protocol: Standardized interface for accessing engineering model metadata
- Unified query layer across heterogeneous sources (Enovia PLM, CATIA, Siemens NX, custom databases)
- Graph-based representation of part relationships and dependencies
Architecture:
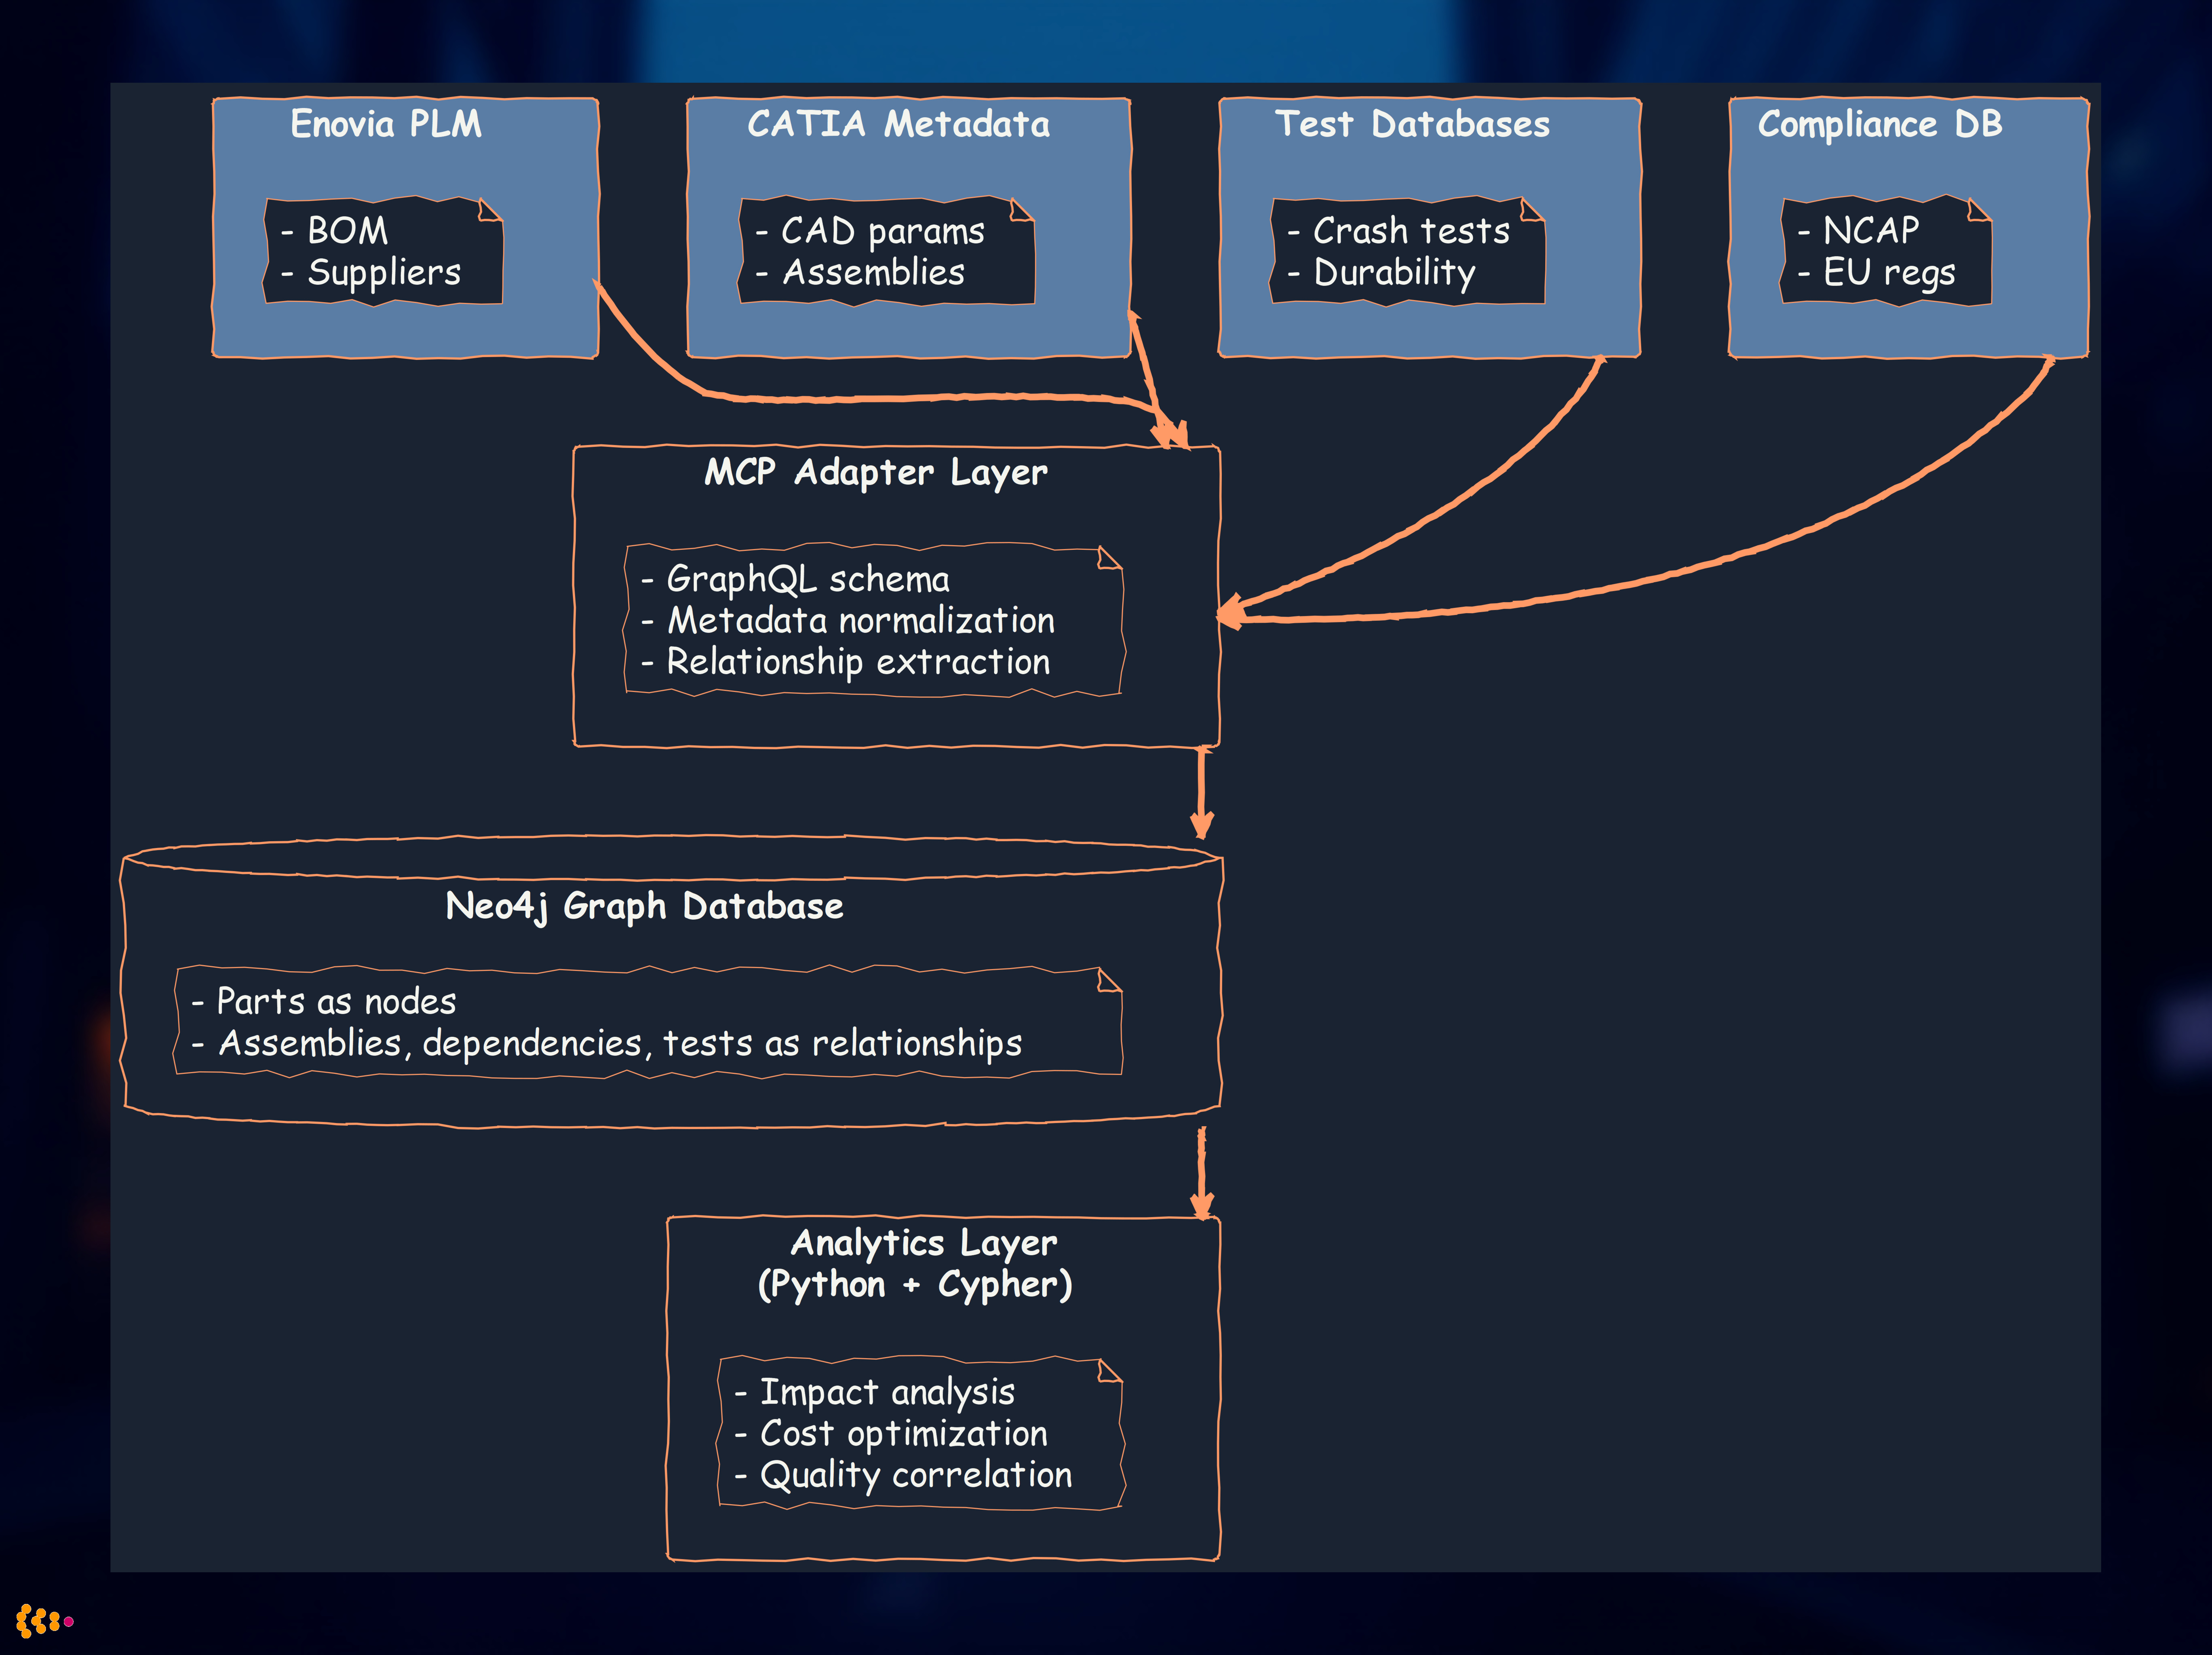
Analytics Use Cases
1. Impact Analysis
- “If we change supplier for part X, which assemblies are affected?”
- Graph query traverses dependency chain in milliseconds
- Previously required manual cross-reference of 5+ systems over days
2. Cost Optimization
- Identify parts with similar specifications but different suppliers/costs
- Analyze cost variance across vehicle platforms
- “Part consolidation opportunities” (15% cost reduction identified)
3. Quality Correlation
- Link test failures to specific part/supplier combinations
- Predictive quality issues based on historical patterns
- “Supplier A’s parts fail 3x more often in crash tests” → renegotiate or switch
4. Compliance Tracking
- Ensure all parts meet regulatory requirements
- Automated gap analysis for new regulations (e.g., new EU battery recycling rules)
- “12 parts need recertification for 2026 NCAP compliance”
Results:
- Engineering query time: 3 days → 30 seconds (600x faster)
- Part consolidation: 15% cost reduction ($40M annual savings)
- Quality issues detected earlier: 6-month lead time vs. at-production discovery
- Compliance confidence: 100% traceability for audits (previously ~85%)
Project Experience 7: MATLAB/Octave for Signal Processing
When MATLAB is Non-Negotiable
Certain engineering domains have MATLAB as the de facto standard:
- Signal processing (toolboxes unmatched)
- Control systems (Simulink integration)
- Image processing (computer vision)
- Engineering legacy (existing codebases, team expertise)
Octave: Open-source MATLAB alternative (mostly compatible, free)
Use Case: Vibration Analysis for NVH Testing
Challenge: Automotive NVH (noise, vibration, harshness) testing generates terabytes of sensor data. Engineers needed to:
- Identify resonance frequencies
- Detect abnormal vibration patterns
- Correlate vibration with road conditions and speed
Our MATLAB-based analytics:
Signal processing pipeline:
% Load sensor data (accelerometer, microphone)
data = load('test_vehicle_123.mat');

% Preprocessing: filtering, detrending
filtered = lowpass(data.acceleration, 500, 1000); % 500 Hz cutoff, 1 kHz sample rate

% FFT for frequency domain analysis
Y = fft(filtered);
f = (0:length(Y)-1) * 1000 / length(Y); % Frequency vector

% Power spectral density
psd = pwelch(filtered, 1024, 512, 1024, 1000);

% Resonance detection (peaks in PSD)
[peaks, locs] = findpeaks(psd, 'MinPeakHeight', threshold);

% Anomaly detection (compare to baseline)
baseline = load('reference_vehicle.mat');
deviation = abs(psd - baseline.psd);
anomalies = find(deviation > 2 * std(baseline.psd));
Integration with Python analytics:
- MATLAB for signal processing (domain expertise, toolboxes)
- Export results to CSV/HDF5
- Python for visualization, reporting, database storage
Results:
- Automated analysis: 80 hours manual work → 2 hours automated per test vehicle
- Earlier issue detection: Identified bearing failure pattern 2 months before failure
- Standardized reporting: Consistent analysis across 200+ test vehicles
- Cost savings: €500K annually in engineering time
Data Quality: The Foundation of Reliable Analytics
Outlier Detection for Data Quality Assurance
Principle: Garbage in, garbage out. Analytics are only as good as the underlying data.
Our multi-layered quality approach:
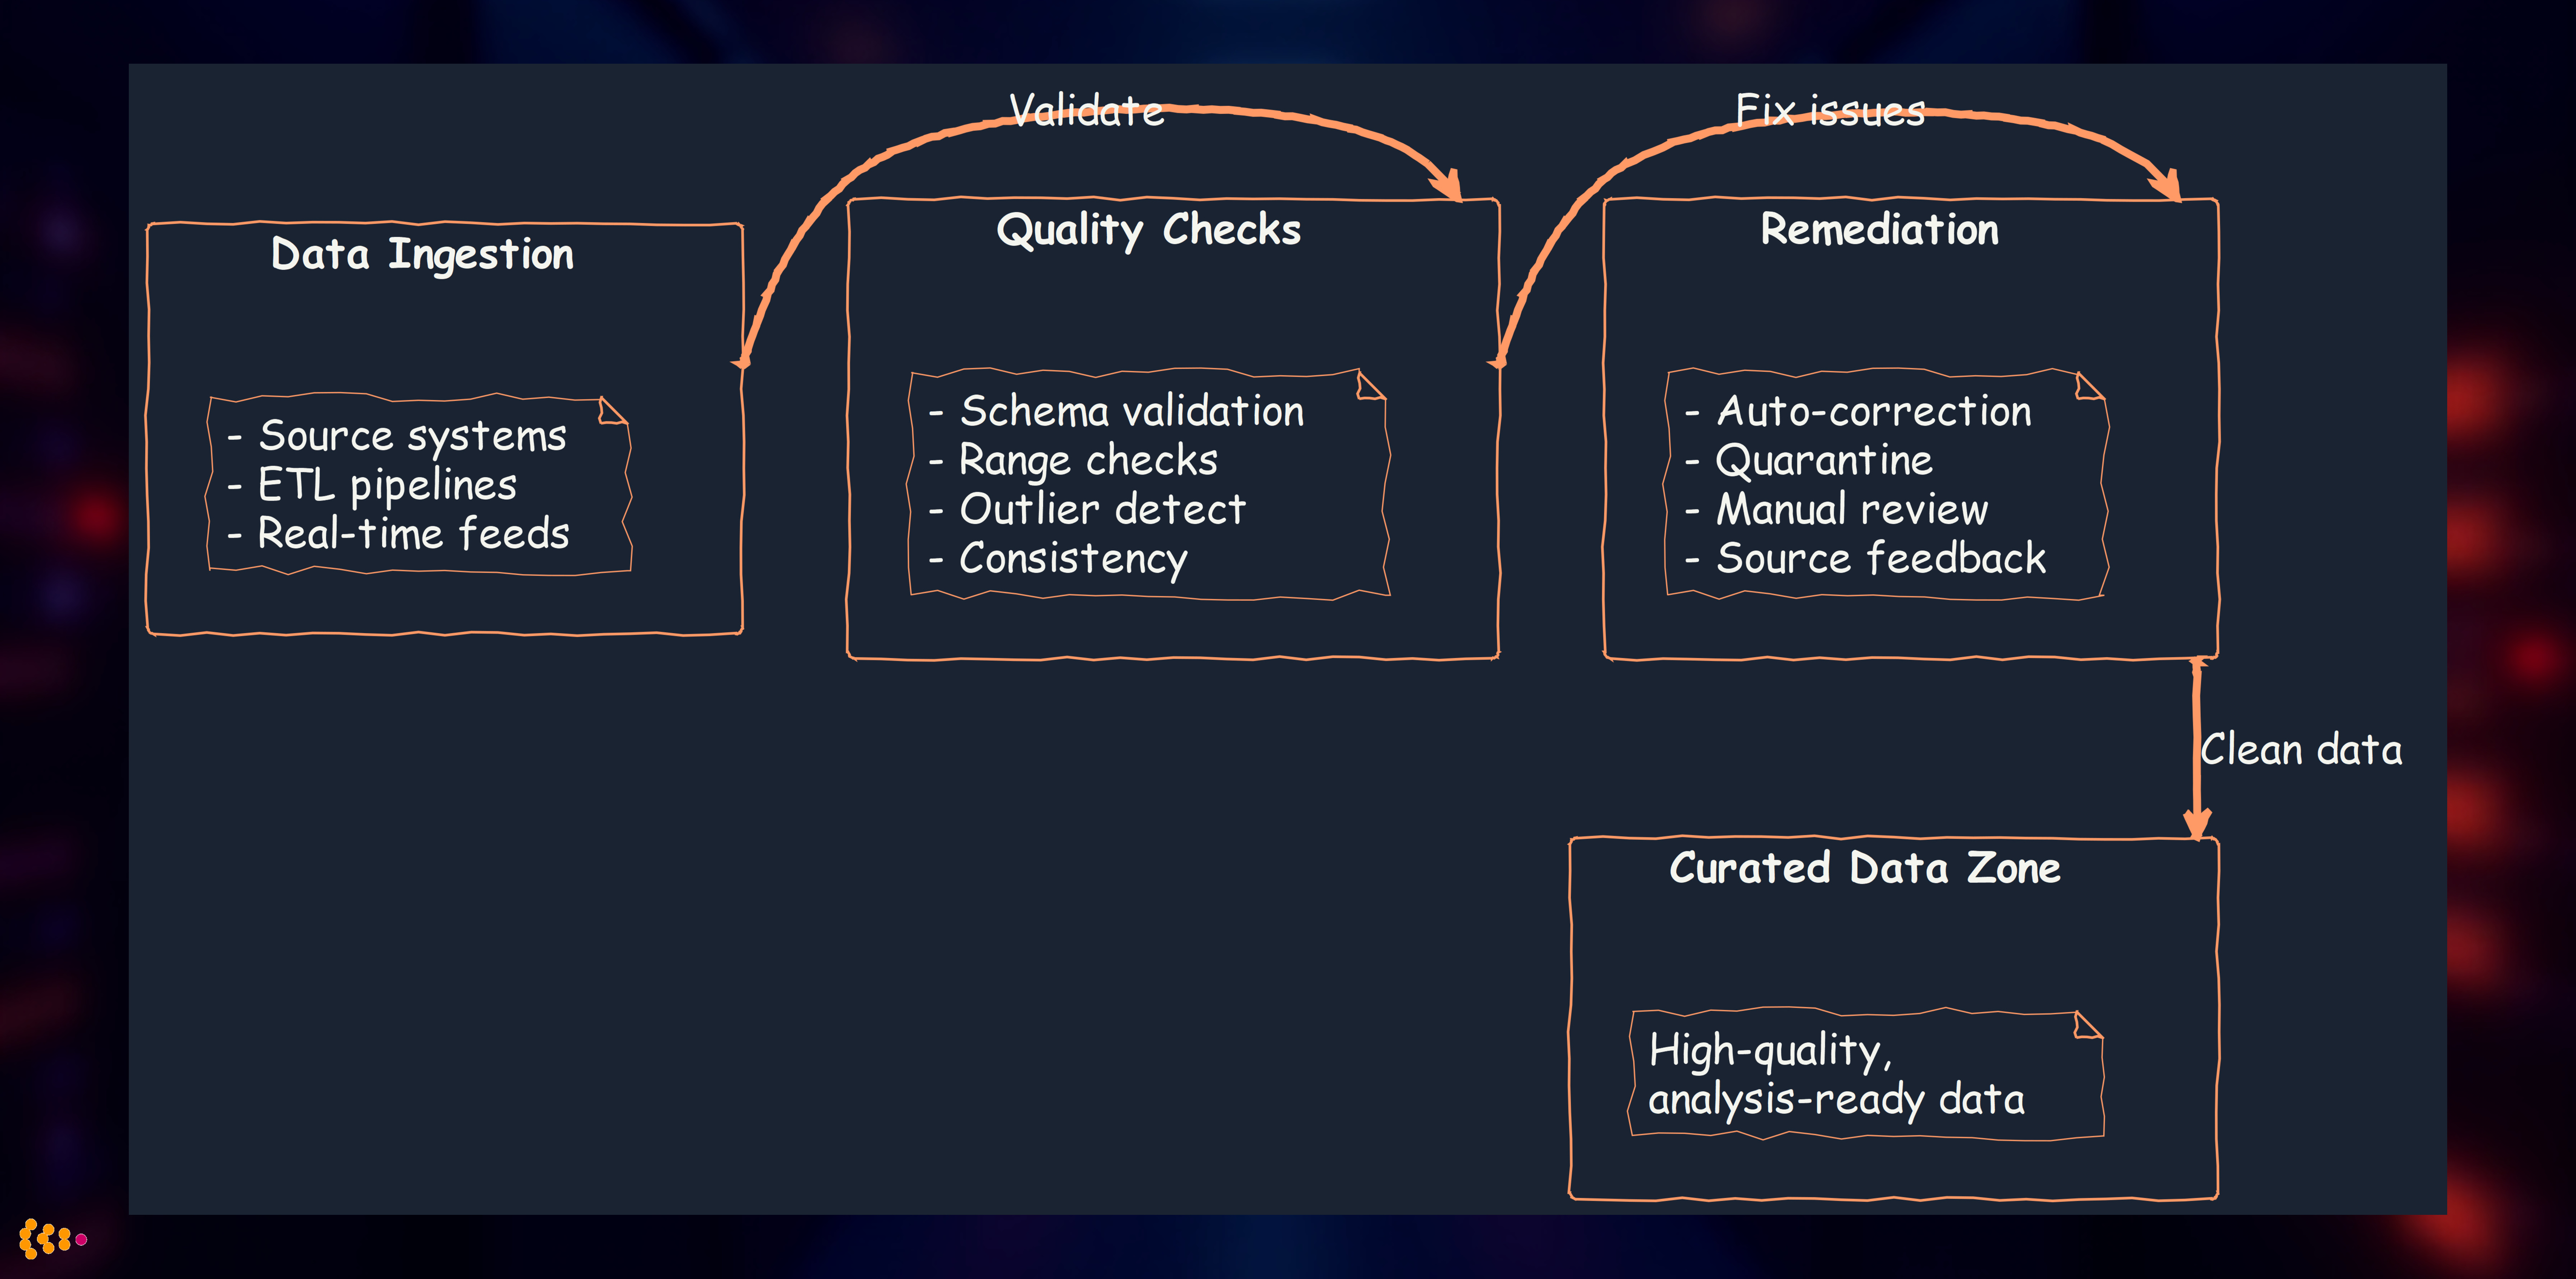
Outlier Detection Techniques We Use
1. Statistical Methods (Python + scipy)
# Z-score method
z_scores = np.abs(stats.zscore(data))
outliers = data[z_scores > 3]  # >3 standard deviations

# IQR (Interquartile Range) method
Q1, Q3 = np.percentile(data, [25, 75])
IQR = Q3 - Q1
outliers = data[(data < Q1 - 1.5*IQR) | (data > Q3 + 1.5*IQR)]
2. Machine Learning Methods (Python + scikit-learn)
from sklearn.ensemble import IsolationForest

# Isolation Forest for multivariate outlier detection
iso_forest = IsolationForest(contamination=0.05)  # Expect 5% outliers
predictions = iso_forest.fit_predict(data)
outliers = data[predictions == -1]
3. Domain-Specific Rules
- Manufacturing: Sensor value outside physical possibility (negative pressure, >100°C ambient)
- Financial: Transaction amount >3x customer’s typical spending
- Survey: Completion time <20% of median (speeder detection)
Real-World Impact: Automotive Quality Data
Challenge: Quality inspection data from 50 factories worldwide, 2,000+ inspectors, 500,000 inspections/month
Quality issues identified:
- Sensor calibration drift: 12 factories had temperature sensors reading 5-8°C too high
- Inspector training gaps: 3% of inspectors consistently marked “pass” on items that should fail (statistical outlier vs. peers)
- Data entry errors: 0.5% of records had typos (e.g., “1000” instead of “10.00” for measurement)
Our outlier detection system:
- Real-time statistical monitoring: Flag readings >3σ from factory baseline
- Cross-factory comparison: Detect systemic issues (all inspectors at Factory X report different patterns)
- Temporal analysis: Sensor drift over time (gradual increase in readings)
- Inter-inspector consistency: Flag inspectors with >10% deviation from peers
Results:
- Data quality increased from 92% to 99.2%
- 15 sensor calibration issues detected and corrected (would have affected 50,000+ parts)
- Inspector retraining program created based on statistical outliers (12% improvement in consistency)
- Cost avoidance: €3M in potential recalls from faulty inspection data
Cross-Platform Integration: Best of All Worlds
The Polyglot Analytics Strategy
Rather than forcing all analytics into one tool, we embrace platform diversity:
Decision matrix:
| Use Case | Preferred Platform | Why |
|---|---|---|
| Data cleaning, ETL | Python (pandas) | Speed, ecosystem, integration |
| Exploratory data analysis | Python or R | Visualization libraries, interactivity |
| Business user self-service | RapidMiner | Visual, no-code, rapid iteration |
| Advanced econometrics | R | Specialized packages (econometrics, Bayesian) |
| Signal processing, control systems | MATLAB/Octave | Domain standard, toolbox depth |
| Big data processing | PySpark | Scalability, Spark ecosystem |
| Market research | Custom software | Domain-specific workflows, tight integration |
| Graph analytics | Neo4j + Python | Relationship-heavy queries, performance |
Integration architecture:
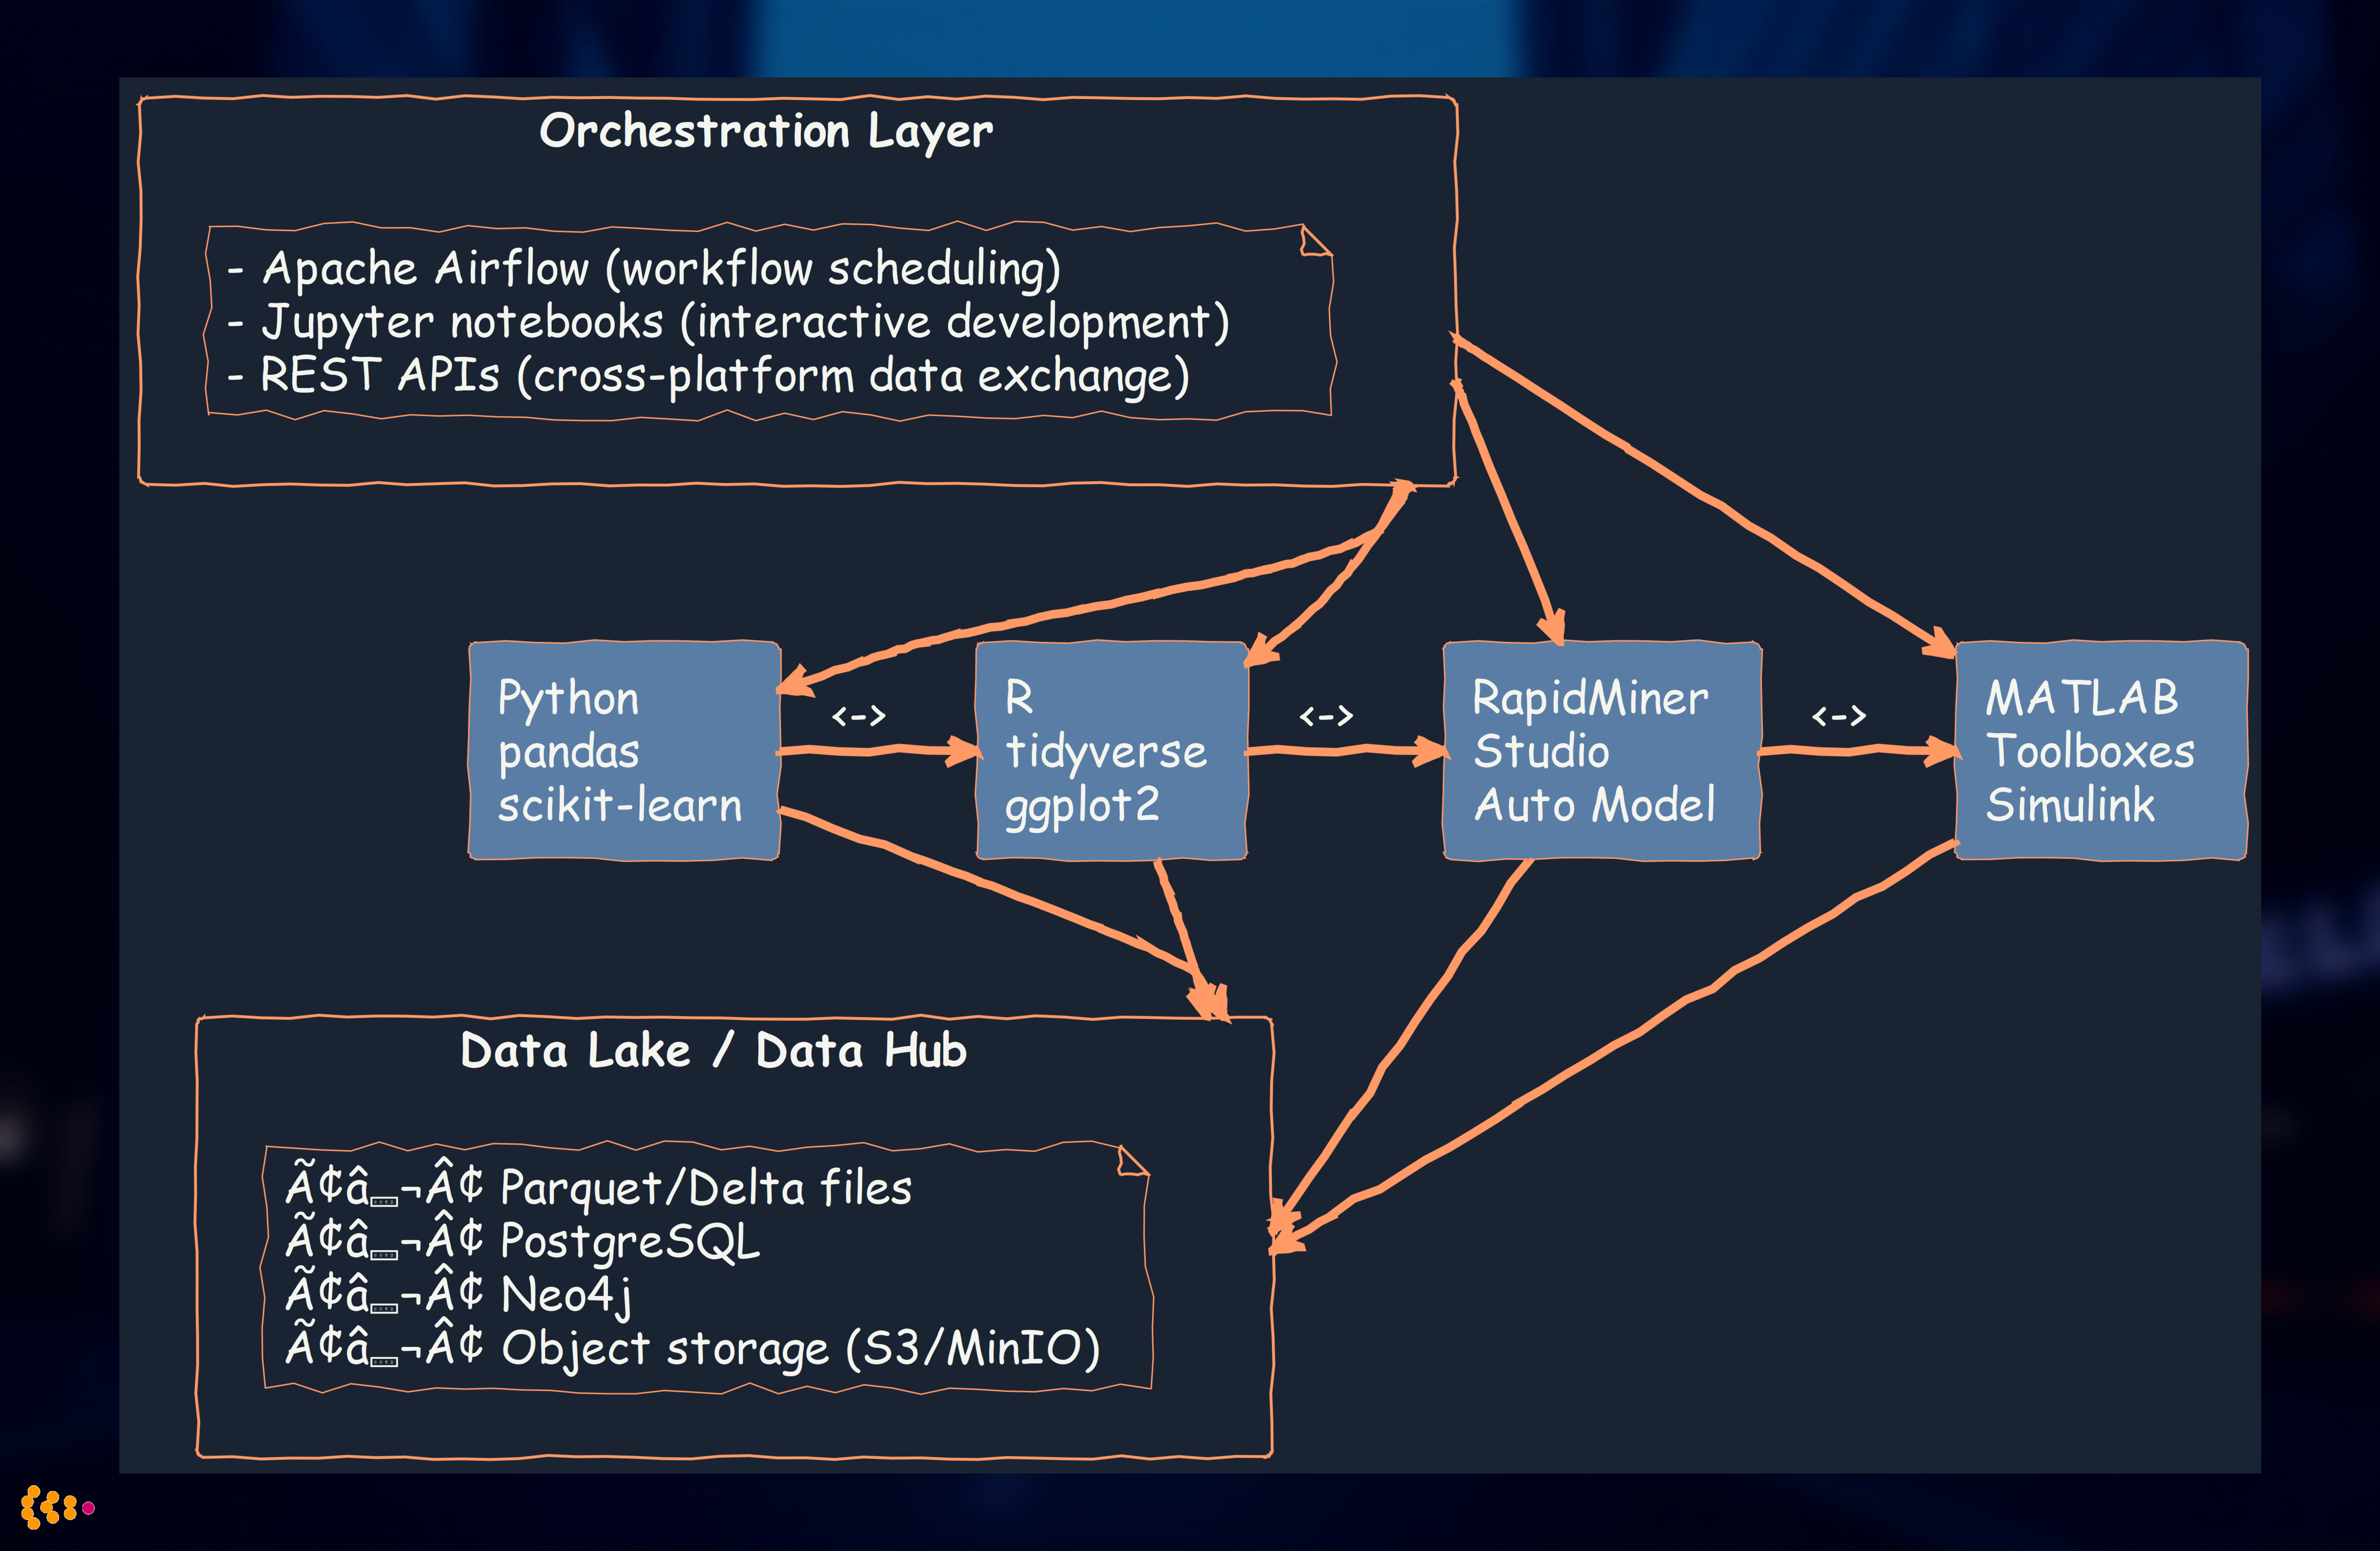
Benefits of polyglot approach:
- Best tool for each job: Don’t force R users to learn Python (and vice versa)
- Leverage domain expertise: Engineers comfortable with MATLAB continue to use it
- Faster development: Use existing, proven tools rather than reinventing
- Team autonomy: Data scientists, statisticians, engineers work with familiar tools
Lessons Learned: Building Enterprise Analytics Capabilities
1. Start with Data Integration, Not Analytics Tools
Anti-pattern: Buy analytics tools first, worry about data later
Best practice:
- Consolidate data sources into data lake/hub
- Ensure data quality and consistency
- Then choose analytics tools based on use cases
Why: 70% of analytics effort is data preparation. Fix the source, not the symptom.
2. Embrace Multi-Platform Expertise
Anti-pattern: “We’re a Python shop” or “We only use R”
Best practice: Choose tools based on:
- Use case requirements (signal processing → MATLAB)
- Team expertise (don’t retrain statisticians to Python if R works)
- Ecosystem maturity (market research → specialized R packages)
Why: Polyglot analytics delivers faster results and happier teams.
3. Custom Software When Justified
When to build custom:
- Domain-specific workflows not supported by off-the-shelf tools
- Tight integration requirements (e.g., panel management + survey platform)
- Competitive advantage (unique analytics = business differentiation)
When to buy/use open-source:
- Standard analytics tasks (regression, clustering, visualization)
- Well-supported use cases (RapidMiner for business user analytics)
- Team lacks development capacity
Rule of thumb: Build only what’s truly unique to your business.
4. Data Quality is Non-Negotiable
Investment in quality:
- Automated validation at ingestion
- Outlier detection systems
- Data lineage tracking (where did this number come from?)
- Feedback loops to source systems (fix root cause, not just symptoms)
ROI: €1 invested in data quality saves €10-100 in bad decisions from faulty data.
5. Balance Automation with Human Judgment
Automate:
- Repetitive quality checks
- Standard reporting and dashboards
- Outlier flagging
Human review:
- Interpretation of results (correlation ≠ causation)
- Domain expertise application (is this outlier real or data error?)
- Strategic decisions (analytics inform, humans decide)
Why: Fully automated analytics without human oversight leads to blind spots and misinterpretation.
Analytics Technology Recommendations
For Greenfield Projects
1. Data Platform:
- Data Lake: Delta Lake on object storage (S3, MinIO, Azure Blob)
- Database: PostgreSQL for structured data, Neo4j for graph data
- ETL: Apache Airflow for orchestration, Python for transformations
2. Analytics Tools:
- Primary: Python (pandas, scikit-learn, matplotlib)
- Statistical: R (tidyverse, ggplot2) for specialized packages
- Business users: RapidMiner Studio or Tableau Prep
- Big data: PySpark when dataset >1TB
3. Deployment:
- Development: Jupyter notebooks, RStudio
- Production: Scheduled pipelines (Airflow), REST APIs (Flask, FastAPI)
- Monitoring: Grafana dashboards, alerting on data quality metrics
For Existing Systems
1. Assess Current Landscape:
- What tools already in use? (Don’t rip and replace unnecessarily)
- What skills on team?
- What data sources need integration?
2. Incremental Approach:
- Phase 1: Consolidate data into hub/lake (6-12 months)
- Phase 2: Pilot advanced analytics on high-value use cases (3-6 months)
- Phase 3: Scale successful pilots, retire legacy tools (ongoing)
3. Migration Strategy:
- Keep existing tools running during migration
- Parallel run period (validate new analytics match old results)
- Gradual cutover as confidence builds
Conclusion: Analytics is a Journey, Not a Destination
Over 15+ years of building analytics capabilities, we’ve learned that success requires:
- Solid data foundation: Data lakes, quality assurance, integration
- Multi-platform expertise: Right tool for right job (Python, R, RapidMiner, MATLAB, custom)
- Domain knowledge: Automotive, market research, manufacturing—analytics without context is noise
- Continuous improvement: Outlier detection, feedback loops, iterative refinement
- Human + machine collaboration: Automate repetitive tasks, preserve human judgment for strategy
Our approach delivers:
- Faster time-to-insight: Days instead of weeks for complex analysis
- Higher quality decisions: Reliable data + sophisticated analytics
- Business impact: Millions in cost savings, revenue growth, risk mitigation
- Organizational capability: Teams empowered to answer their own questions
Whether you’re starting from scratch or enhancing existing capabilities, the key is to start with business problems, not tools. Understand what questions you need answered, then build the analytics infrastructure to deliver those answers reliably and repeatedly.
Related Articles:
- Modern Data Architecture with Graph Databases and Streaming — Data lake integration patterns with Neo4j and Kafka
- Machine Learning and Neural Networks in Enterprise Applications — Advanced ML techniques and deployment strategies
- AI Second Philosophy: Business Process First, AI Augmentation Second — Our approach to reliable, business-driven AI
Want to discuss your analytics challenges? Contact us to explore how we can help build your analytics capabilities.